


生物技术通报 ›› 2025, Vol. 41 ›› Issue (12): 139-155.doi: 10.13560/j.cnki.biotech.bull.1985.2025-0571
杨宗辉1( ), 李利斌1, 孟昭娟1, 高天2, 祝利霞3, 杜海梅4, 董伟伟5, 曹齐卫1()
收稿日期:2025-06-03
出版日期:2025-12-26
发布日期:2026-01-06
通讯作者:
曹齐卫,男,硕士,研究员,研究方向 :黄瓜遗传育种;E-mail: qiweicao1979@163.com作者简介:杨宗辉,男,博士,助理研究员,研究方向 :黄瓜分子育种;E-mail: ksprings@163.com
基金资助:
YANG Zong-hui1(), LI Li-bin1, MENG Zhao-juan1, GAO Tian2, ZHU Li-xia3, DU Hai-mei4, DONG Wei-wei5, CAO Qi-wei1()
Received:2025-06-03
Published:2025-12-26
Online:2026-01-06
摘要:
目的 发掘调控黄瓜性别决定的关键基因及调控通路,为培育高产黄瓜品种提供理论依据,并为理解双子叶植物性别决定机制奠定基础。 方法 以黄瓜雌性系X8g(纯雌株)与普通系X8(雌雄株)近等基因系为材料,采用RNA-Seq技术对四叶一心期花芽分生组织进行转录组测序分析。通过差异表达分析、主成分分析和方差分解分析3种策略整合筛选关键基因。利用OrthoFinder鉴定黄瓜与拟南芥的直系同源基因,开展跨物种比较转录组分析,以探究调控网络的保守性与特异性。运用VIGS技术对核心候选基因CsACO2进行功能验证,采用qPCR检测基因沉默效率和特异性。使用DNA甲基化抑制剂5-氮杂胞苷处理雌性系植株验证表观遗传调控作用。 结果 在黄瓜雌性系与普通系之间共鉴定到197个差异表达基因,其中43个上调,154个下调,这些基因显著富集于花器官形态建成、α-亚麻酸(茉莉酸合成前体)代谢等通路。多维度分析共同确定了一些核心候选基因,包括已知的乙烯合成关键基因CsACO2和新发现的MADS-box家族转录因子AGL6、MADS4等。跨物种比较分析显示,黄瓜与拟南芥同源基因的表达模式总体相关性弱,但揭示了乙烯响应因子EIN3、NAC053转录因子靶基因集以及H3K27me3表观修饰在黄瓜性别调控中的潜在重要作用。功能验证实验证明,在雌性系中特异性沉默CsACO2能够诱导雄花和两性花的产生;而施用DNA甲基化抑制剂5-azacytidine同样能使雌性系植株开出雄花。 结论 系统揭示黄瓜性别决定是由乙烯信号通路主导,并可能由茉莉酸代谢、多类转录因子以及表观遗传协同作用的复杂分子网络。
杨宗辉, 李利斌, 孟昭娟, 高天, 祝利霞, 杜海梅, 董伟伟, 曹齐卫. 比较转录组学揭示乙烯信号与表观遗传协同调控黄瓜性别决定[J]. 生物技术通报, 2025, 41(12): 139-155.
YANG Zong-hui, LI Li-bin, MENG Zhao-juan, GAO Tian, ZHU Li-xia, DU Hai-mei, DONG Wei-wei, CAO Qi-wei. Comparative Transcriptomics Reveals Synergistic Control of Cucumber Sex Determination by Ethylene Signaling and Epigenetic Regulation[J]. Biotechnology Bulletin, 2025, 41(12): 139-155.
样本编号 Sample ID | 清洁读数 Clean reads | 清洁碱基数 Clean bases (bp) | GC 含量 GC content (%) | Q30 碱基比例 Q30 (%) |
|---|---|---|---|---|
| T01 | 25 139 532 | 7 511 087 362 | 44.41 | 93.75 |
| T02 | 23 678 722 | 7 068 974 554 | 44.57 | 93.75 |
| T03 | 29 026 750 | 8 662 561 328 | 44.31 | 94.09 |
| T04 | 31 798 263 | 9 491 036 146 | 44.43 | 93.77 |
| T05 | 26 566 141 | 7 941 970 238 | 44.24 | 93.74 |
| T06 | 28 078 078 | 8 390 027 920 | 44.29 | 93.69 |
表1 测序数据的基本统计表
Table 1 Basic statistics of sequencing data
样本编号 Sample ID | 清洁读数 Clean reads | 清洁碱基数 Clean bases (bp) | GC 含量 GC content (%) | Q30 碱基比例 Q30 (%) |
|---|---|---|---|---|
| T01 | 25 139 532 | 7 511 087 362 | 44.41 | 93.75 |
| T02 | 23 678 722 | 7 068 974 554 | 44.57 | 93.75 |
| T03 | 29 026 750 | 8 662 561 328 | 44.31 | 94.09 |
| T04 | 31 798 263 | 9 491 036 146 | 44.43 | 93.77 |
| T05 | 26 566 141 | 7 941 970 238 | 44.24 | 93.74 |
| T06 | 28 078 078 | 8 390 027 920 | 44.29 | 93.69 |
样本编号 Sample ID | 总读数 Total reads | 比对读数 Mapped reads | 唯一比对读数 Uniquely mapped reads | 多重比对读数 Multi-mapped reads | 正链比对读数 Mapped reads on+strand | 负链比对读数 Mapped reads on-strand |
|---|---|---|---|---|---|---|
| T01 | 50 279 064 | 48 741 549 (96.94%) | 47 020 390 (93.52%) | 1 721 159 (3.42%) | 24 142 446 | 24 233 782 |
| T02 | 47 357 444 | 45 842 026 (96.80%) | 44 215 419 (93.37%) | 1 626 607 (3.43%) | 22 699 707 | 22 792 183 |
| T03 | 58 053 500 | 56 296 505 (96.97%) | 54 317 173 (93.56%) | 1 979 332 (3.41%) | 27 877 852 | 27 989 891 |
| T04 | 63 596 526 | 61 603 424 (96.87%) | 59 470 279 (93.51%) | 2 133 145 (3.35%) | 30 511 057 | 30 629 863 |
| T05 | 53 132 282 | 51 558 779 (97.04%) | 49 751 449 (93.64%) | 1 807 330 (3.40%) | 25 547 018 | 25 635 938 |
| T06 | 56 156 156 | 54 471 955 (97.00%) | 52 558 943 (93.59%) | 1 913 012 (3.41%) | 26 972 777 | 27 079 418 |
表2 比对结果统计表
Table 2 Statistics of mapping results
样本编号 Sample ID | 总读数 Total reads | 比对读数 Mapped reads | 唯一比对读数 Uniquely mapped reads | 多重比对读数 Multi-mapped reads | 正链比对读数 Mapped reads on+strand | 负链比对读数 Mapped reads on-strand |
|---|---|---|---|---|---|---|
| T01 | 50 279 064 | 48 741 549 (96.94%) | 47 020 390 (93.52%) | 1 721 159 (3.42%) | 24 142 446 | 24 233 782 |
| T02 | 47 357 444 | 45 842 026 (96.80%) | 44 215 419 (93.37%) | 1 626 607 (3.43%) | 22 699 707 | 22 792 183 |
| T03 | 58 053 500 | 56 296 505 (96.97%) | 54 317 173 (93.56%) | 1 979 332 (3.41%) | 27 877 852 | 27 989 891 |
| T04 | 63 596 526 | 61 603 424 (96.87%) | 59 470 279 (93.51%) | 2 133 145 (3.35%) | 30 511 057 | 30 629 863 |
| T05 | 53 132 282 | 51 558 779 (97.04%) | 49 751 449 (93.64%) | 1 807 330 (3.40%) | 25 547 018 | 25 635 938 |
| T06 | 56 156 156 | 54 471 955 (97.00%) | 52 558 943 (93.59%) | 1 913 012 (3.41%) | 26 972 777 | 27 079 418 |
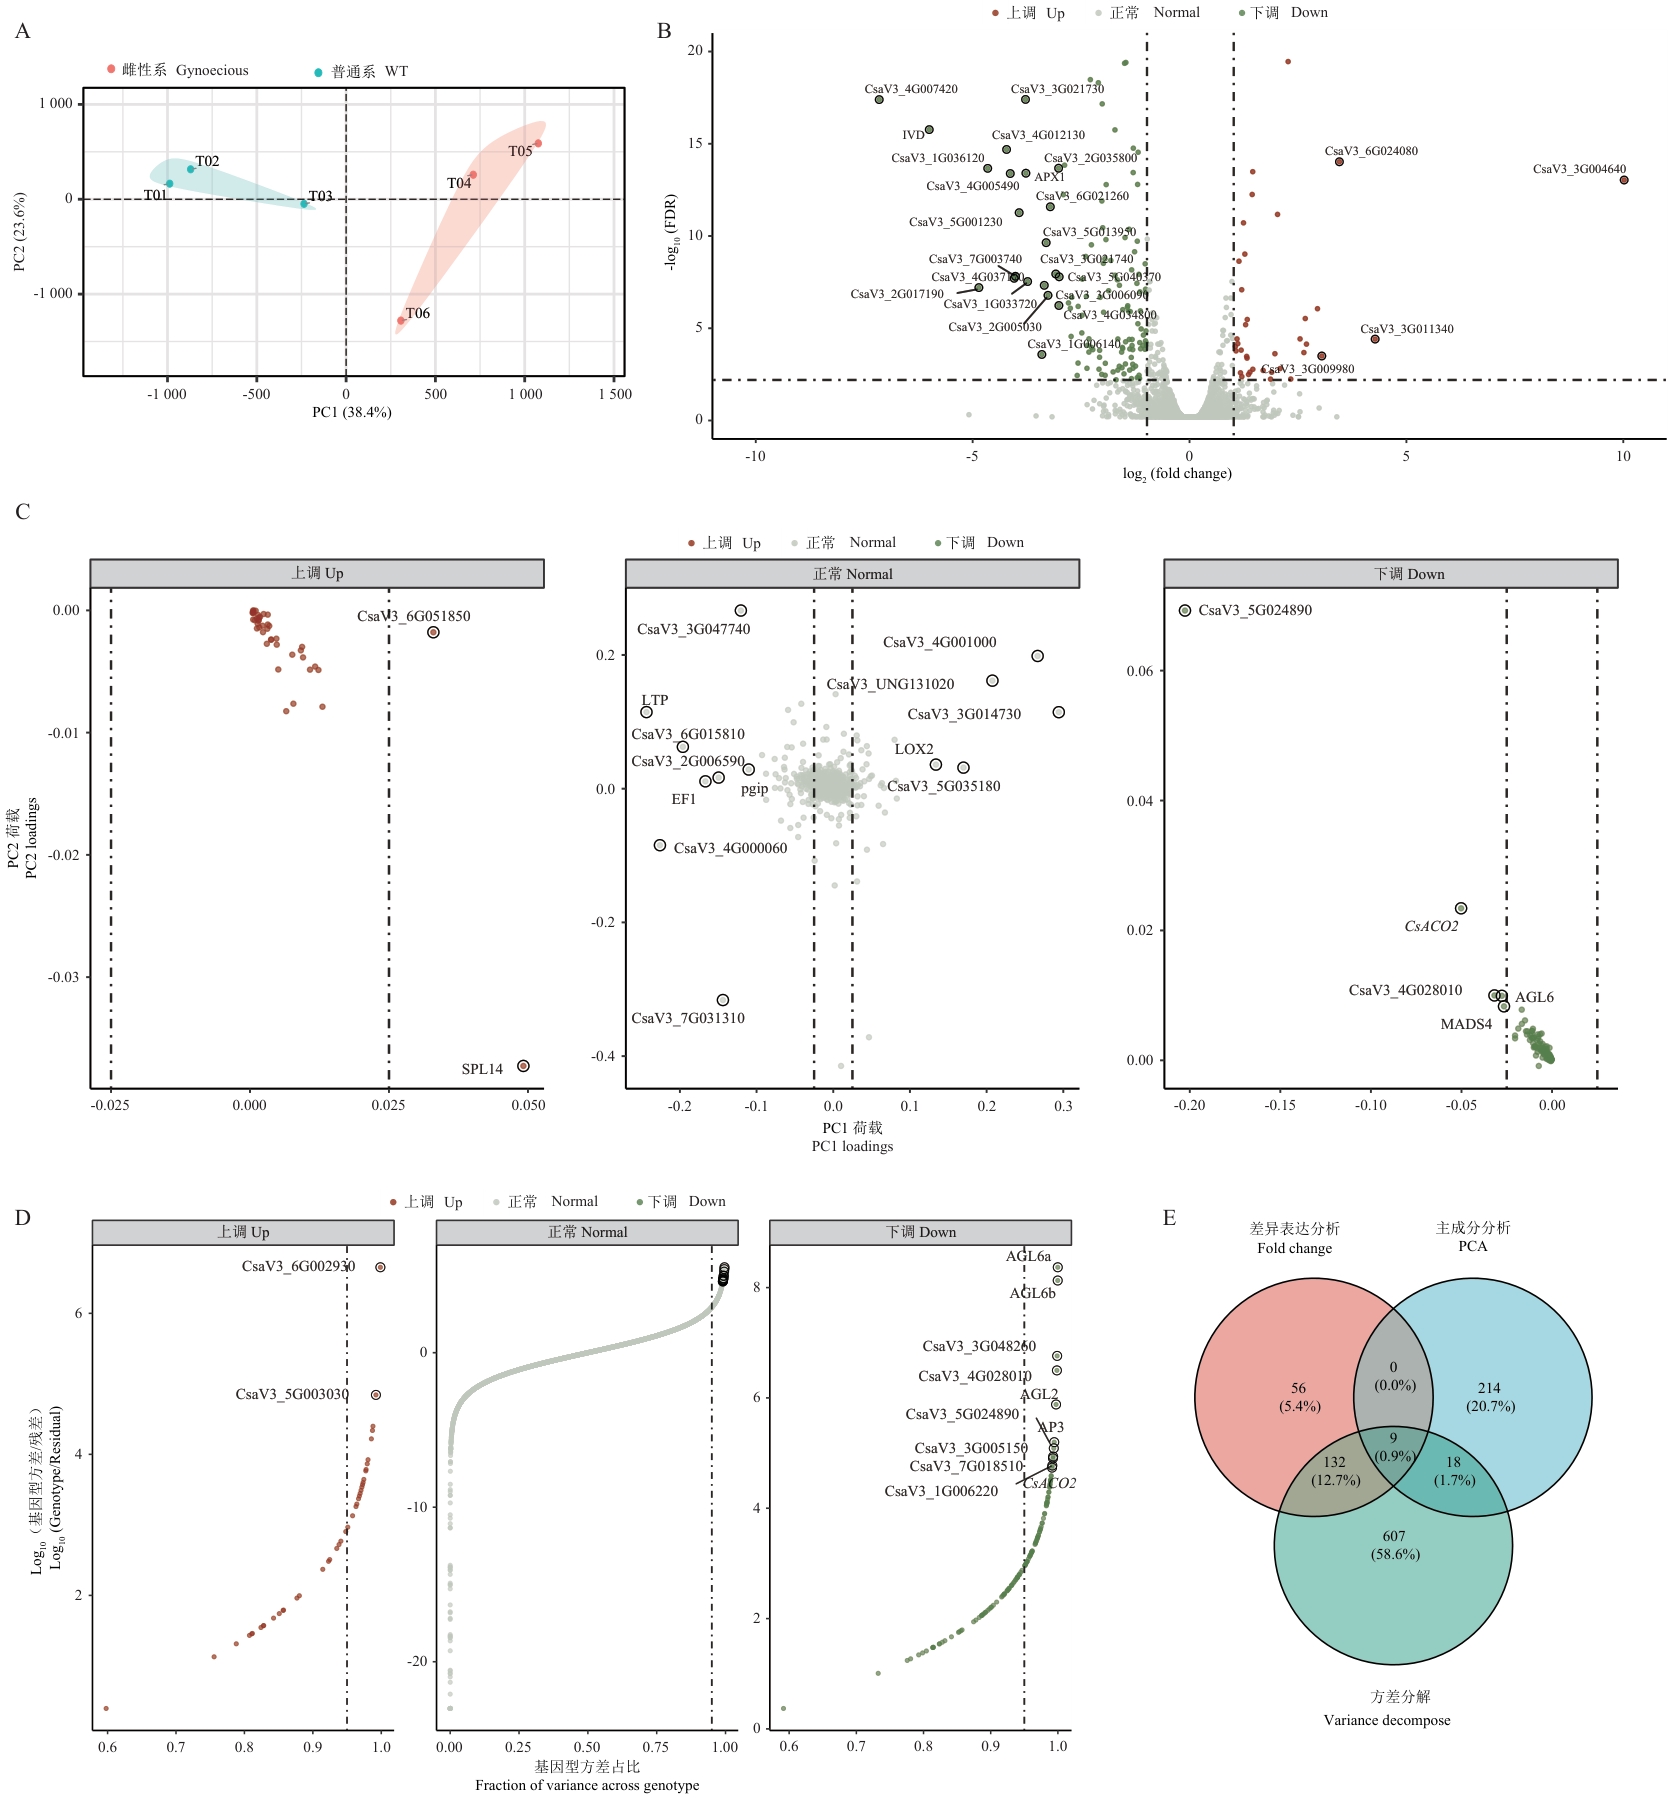
图1 黄瓜雌性系与普通系的转录组表达特征分析A:主成分分析(PCA)散点图展示样品间的整体表达差异;PC1和PC2分别解释38.4%和23.6%的表达变异;不同颜色表示不同基因型:雌性系(红色)和普通系(蓝色);B:火山图展示差异表达基因的分布;红色和蓝色点分别表示显著上调(43个)和下调(154个)的基因(|log2FC|>=1,FDR<0.01);突出显示了部分差异表达倍数超过3倍的基因;C:基因在PC1和PC2方向上的载荷值分布;点的颜色表示基因的差异表达状态;突出显示了部分具有高PC1载荷值的关键基因;D:基因表达方差分解分析;X轴表示基因型解释的方差占比,Y轴表示基因型方差与残差方差的对数比值;突出显示了部分基因型方差贡献率极高(图中示例为>0.99)的基因,以直观展示其表达主要受基因型驱动;E:韦恩图展示3种基因筛选方法(差异表达分析、主成分分析和方差分解)结果的重叠情况;数字表示各区域基因数量及占比
Fig. 1 Transcriptome expression pattern analysis of gynoecious and monoecious cucumber linesA: Principal component analysis (PCA) plot showing overall expression differences among samples. PC1 and PC2 explain 38.4% and 23.6% of expression variation, respectively. Colors indicate different genotypes: gynoecious (red) and monoecious (blue). B: Volcano plot showing the distribution of differentially expressed genes. Red and blue dots represent significantly up-regulated (43) and down-regulated (154) genes (|log2FC|>=1, FDR<0.01). Highlighted are the genes with a fold change in expression exceeding 3 times. C: Distribution of gene loadings on PC1 and PC2. Dot colors indicate differential expression status. Key genes with high PC1 loadings are highlighted. D: Variance decomposition analysis of gene expression. The X-axis shows the distribution of genotype variance proportions, while the Y-axis displays the logarithmic ratio of genotype variance to residuals. Highlighted are the genes with a genotype variance proportion exceeding 0.99. E: Venn diagram showing the overlap among genes identified by three screening methods (differential expression analysis, principal component analysis, and variance decomposition). Numbers indicate gene counts and percentages in each region
基因编号 Gene ID | 基因名称 Gene name | log2倍数变化 log2FC | 表达调控 Regulation | PC1载荷值 PC1 loading | 基因型方差占比 Fraction of variance across genotypes |
|---|---|---|---|---|---|
| CsaV3_2G032190 | -- | -1.23 | 下调 | -0.020 | 0.927 |
| CsaV3_3G040160 | -- | -1.74 | 下调 | -0.020 | 0.931 |
| CsaV3_4G028010 | -- | -2.43 | 下调 | -0.032 | 0.998 |
| CsaV3_4G037760 | SPL14 | 1.26 | 上调 | 0.049 | 0.938 |
| CsaV3_5G024890 | -- | -5.41 | 下调 | -0.203 | 0.994 |
| CsaV3_6G006010 | AGL6 | -1.98 | 下调 | -0.028 | 0.999 |
| CsaV3_6G008200 | MADS4 | -2.90 | 下调 | -0.027 | 0.988 |
| CsaV3_6G048630 | CsACO2 | -1.20 | 下调 | -0.050 | 0.991 |
| CsaV3_6G051850 | -- | 2.81 | 上调 | 0.033 | 0.964 |
表3 三种方法共同筛选的关键基因及其表达特征
Table 3 Key genes identified by three screening methods and their expression characteristics
基因编号 Gene ID | 基因名称 Gene name | log2倍数变化 log2FC | 表达调控 Regulation | PC1载荷值 PC1 loading | 基因型方差占比 Fraction of variance across genotypes |
|---|---|---|---|---|---|
| CsaV3_2G032190 | -- | -1.23 | 下调 | -0.020 | 0.927 |
| CsaV3_3G040160 | -- | -1.74 | 下调 | -0.020 | 0.931 |
| CsaV3_4G028010 | -- | -2.43 | 下调 | -0.032 | 0.998 |
| CsaV3_4G037760 | SPL14 | 1.26 | 上调 | 0.049 | 0.938 |
| CsaV3_5G024890 | -- | -5.41 | 下调 | -0.203 | 0.994 |
| CsaV3_6G006010 | AGL6 | -1.98 | 下调 | -0.028 | 0.999 |
| CsaV3_6G008200 | MADS4 | -2.90 | 下调 | -0.027 | 0.988 |
| CsaV3_6G048630 | CsACO2 | -1.20 | 下调 | -0.050 | 0.991 |
| CsaV3_6G051850 | -- | 2.81 | 上调 | 0.033 | 0.964 |
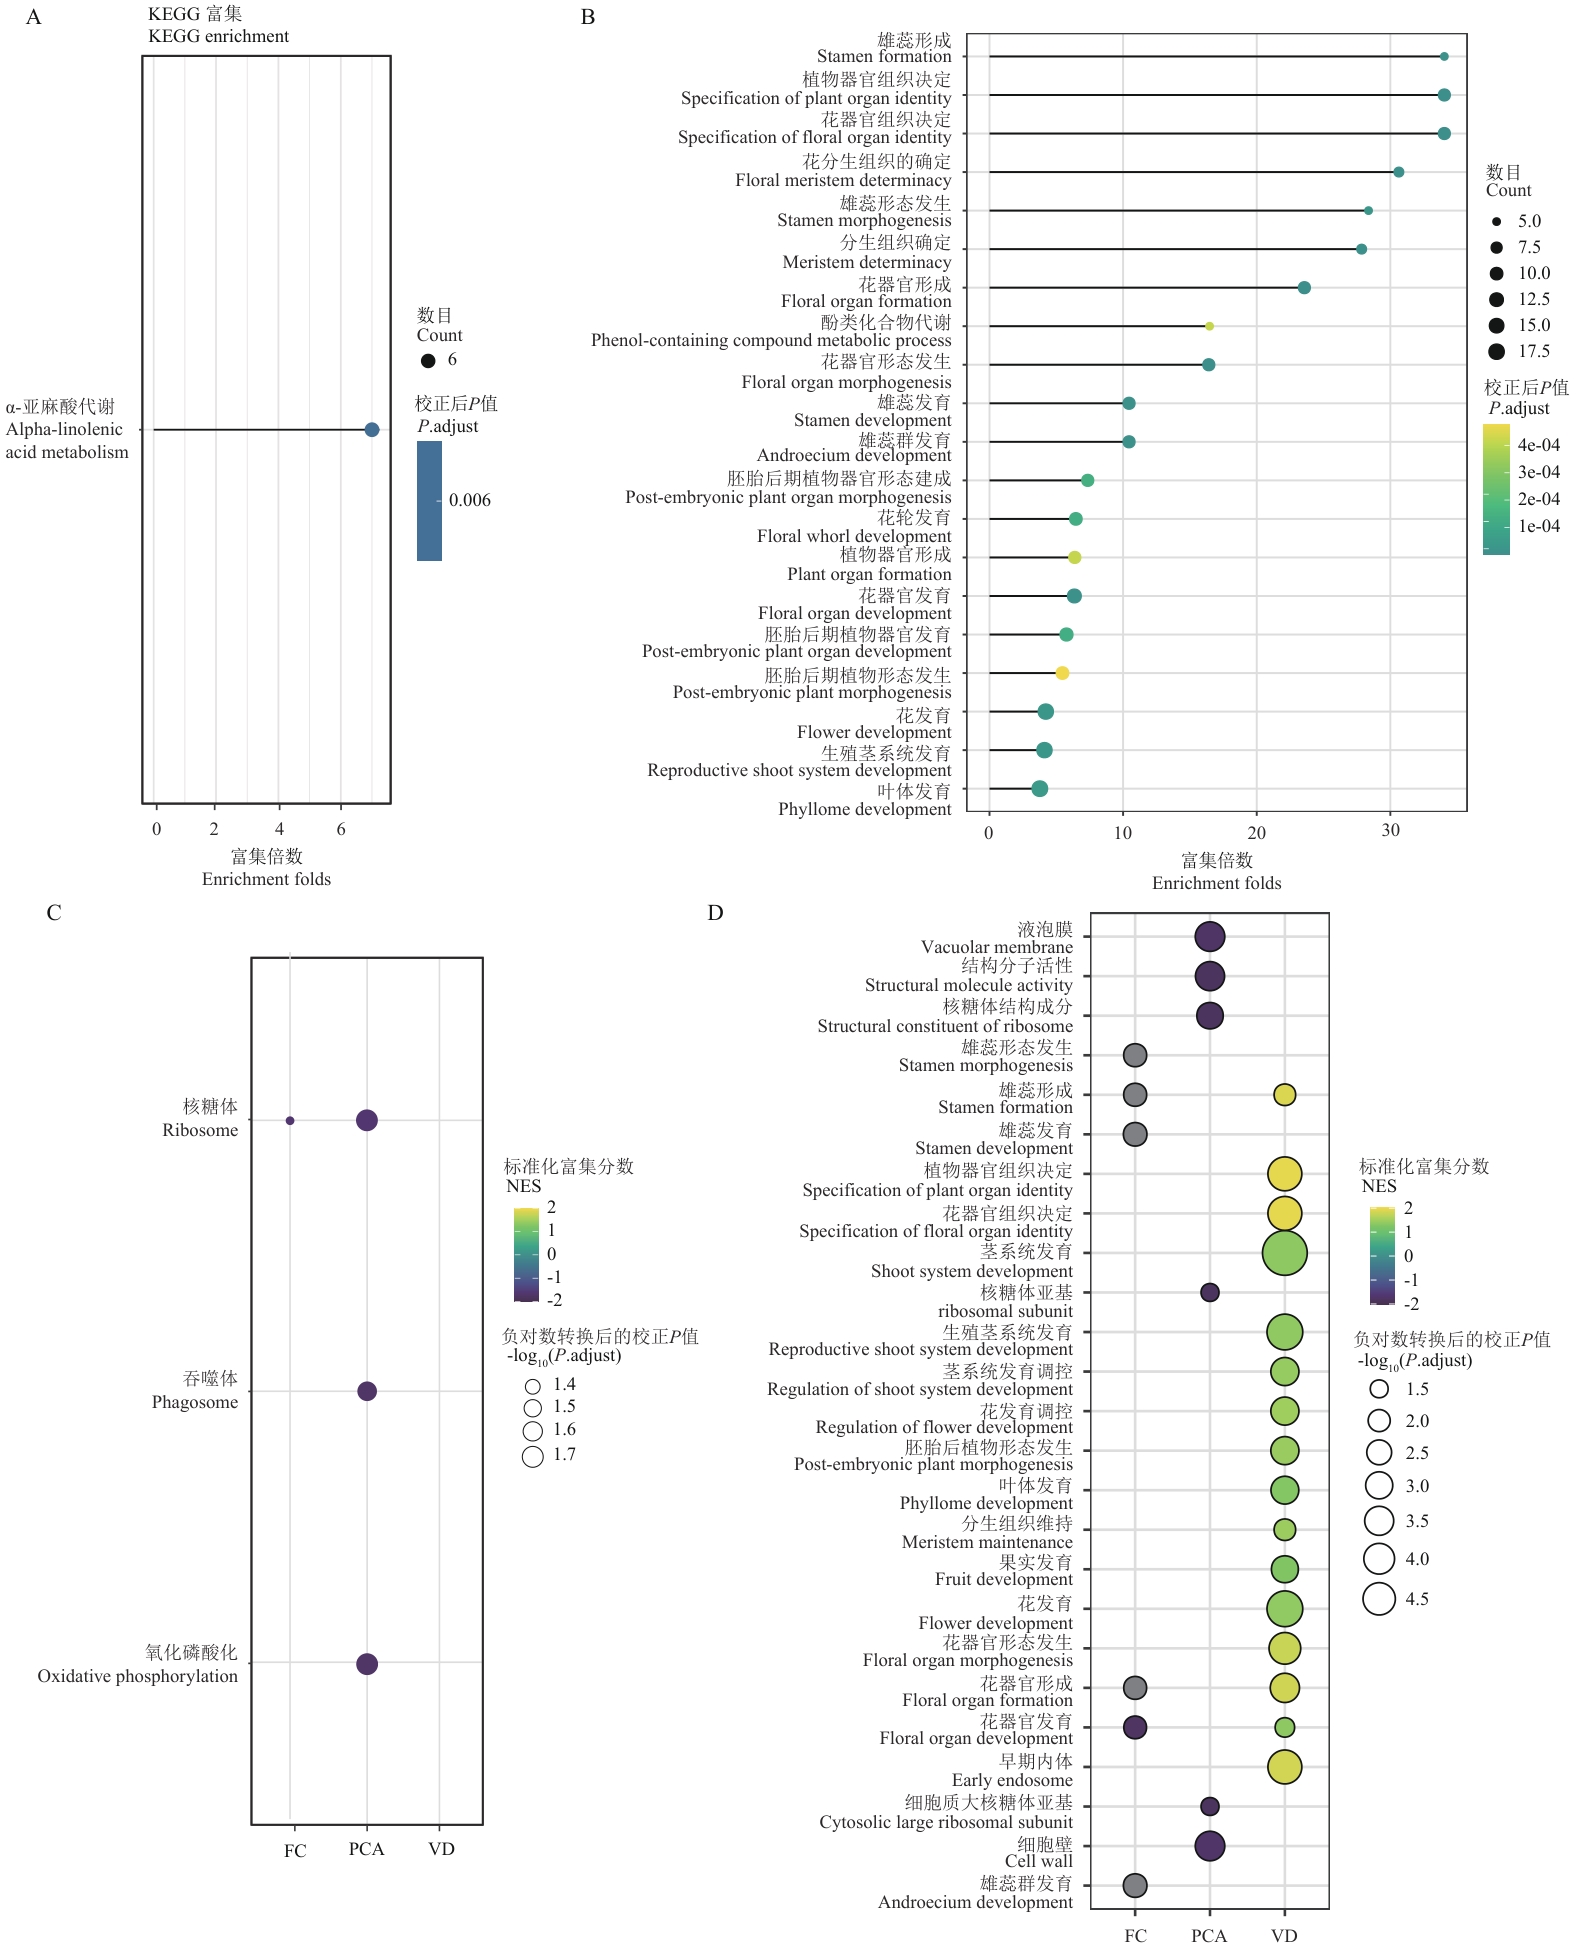
图2 功能富集分析揭示的关键代谢通路和生物学过程A:KEGG通路富集分析结果;气泡大小表示富集基因数目,颜色深浅表示校正后P值显著性水平;B:GO功能富集分析结果;气泡大小表示基因数目,颜色表示校正后P值;C:基于不同筛选策略的KEGG通路富集比较;热图中颜色表示富集得分(NES),黄色表示正向富集,蓝色表示负向富集;圆点大小表示显著性水平[-log10(P. adjust)];D:不同筛选策略获得基因集的GO功能富集比较;热图中颜色表示富集得分(NES),黄色表示正向富集,蓝色表示负向富集。圆点大小表示显著性水平[-log10(P. adjust)]。FC:差异表达分析,PCA:主成分分析,VD:方差分解
Fig. 2 Functional enrichment analysis reveals key metabolic pathways and biological processesA: KEGG pathway enrichment analysis results. Bubble size indicates the number of enriched genes, and color intensity indicates the significance level (adjusted P-value). B: GO functional enrichment analysis results. Bubble size indicates gene count, and color indicates adjusted P-value. C: Comparison of KEGG pathway enrichment based on different screening strategies. Heatmap colors indicate enrichment scores (NES), with yellow indicating positive enrichment and blue indicating negative enrichment. The size of a dot indicates the significance level [-log10(P.adjust)]. D: Comparison of GO functional enrichment for gene sets obtained from different selection strategies. The colors in the heatmap indicate the enrichment score (NES), with yellow indicating positive enrichment and blue indicating negative enrichment. The size of a dot indicates the significance level [-log10(P.adjust)]. FC: Differential expression analysis; PCA: principal component analysis; VD: variance decomposition
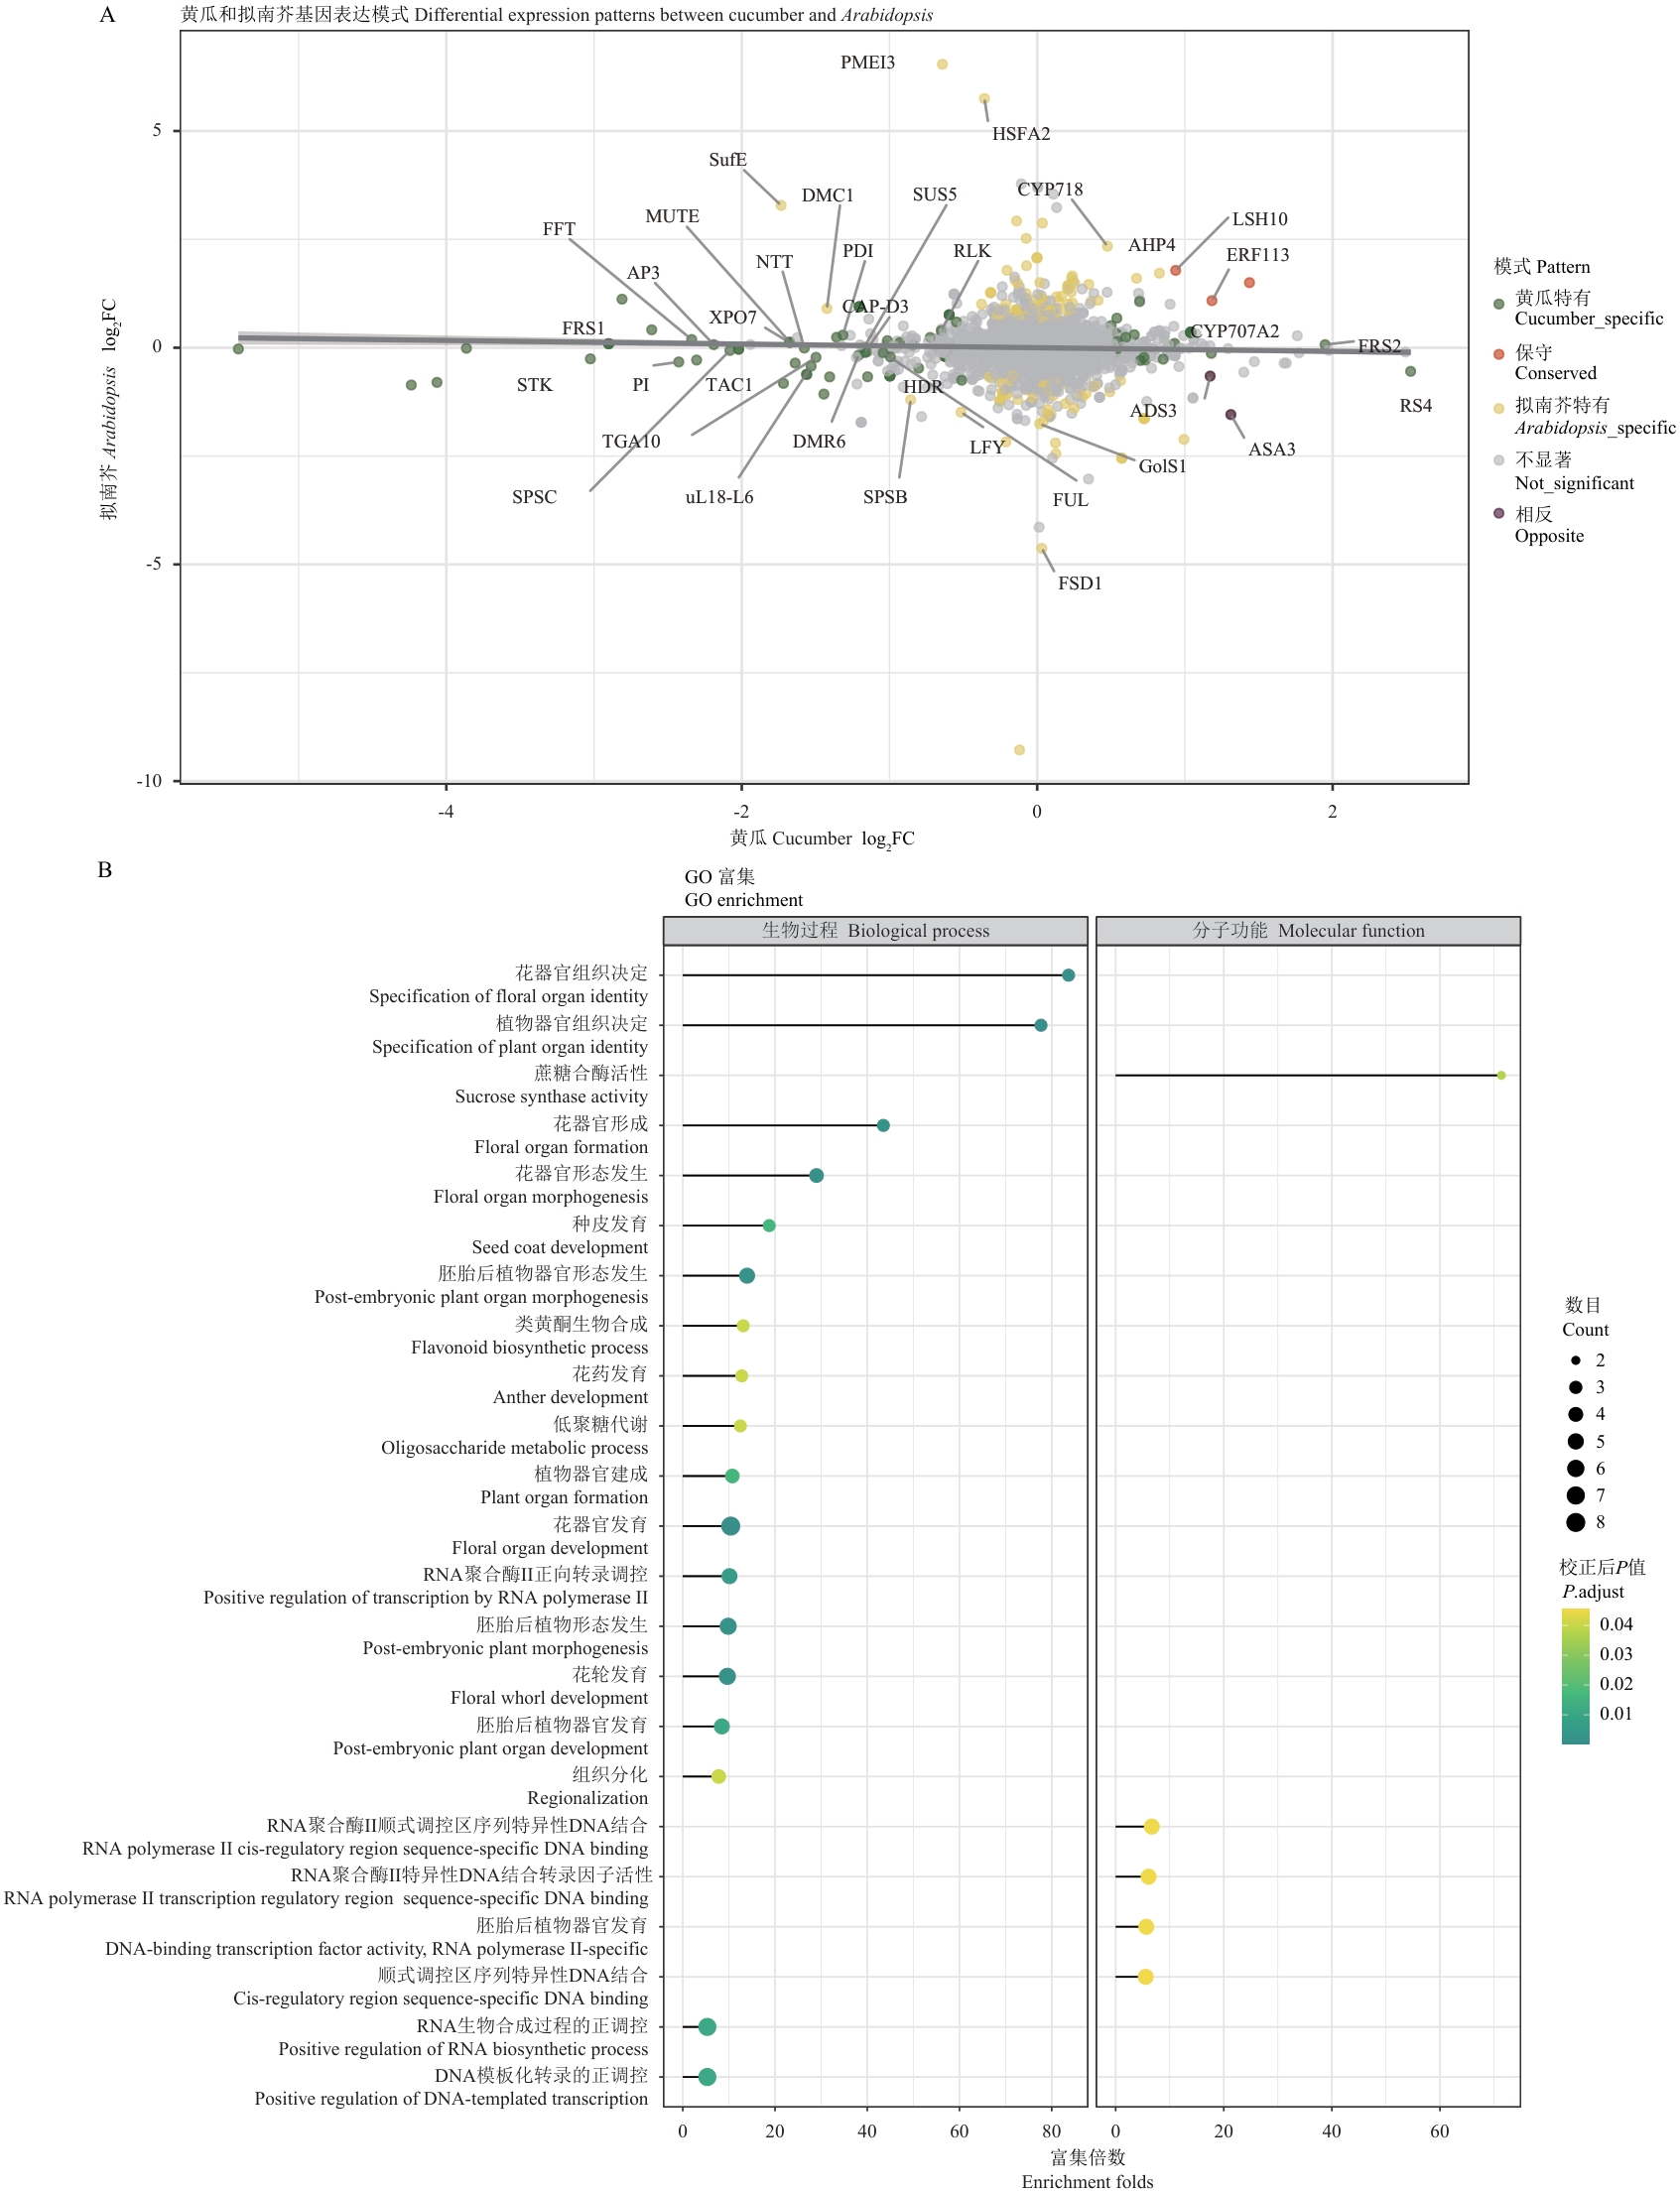
图3 黄瓜与拟南芥同源基因表达模式比较分析A:黄瓜和拟南芥同源基因表达变化的散点图;横轴和纵轴分别表示黄瓜和拟南芥中基因的log2FC值;点的颜色表示不同的表达模式;重要基因用基因名标注;B:黄瓜特异差异表达基因的GO功能富集分析;气泡大小表示基因数量,颜色深浅表示校正后P值显著性水平(P. adjust)
Fig. 3 Comparative analysis of orthologus gene expression patterns between cucumber and ArabidopsisA: Scatter plot showing expression changes of orthologous genes between cucumber and Arabidopsis. X-axis and Y-axis indicate log2FC values in cucumber and Arabidopsis, respectively. Colors indicate different expression patterns. Key genes are labeled by gene names. B: GO functional enrichment analysis of cucumber-specific differentially expressed genes. Bubble size indicates gene count, and color intensity indicates significance level (adjusted P-value)
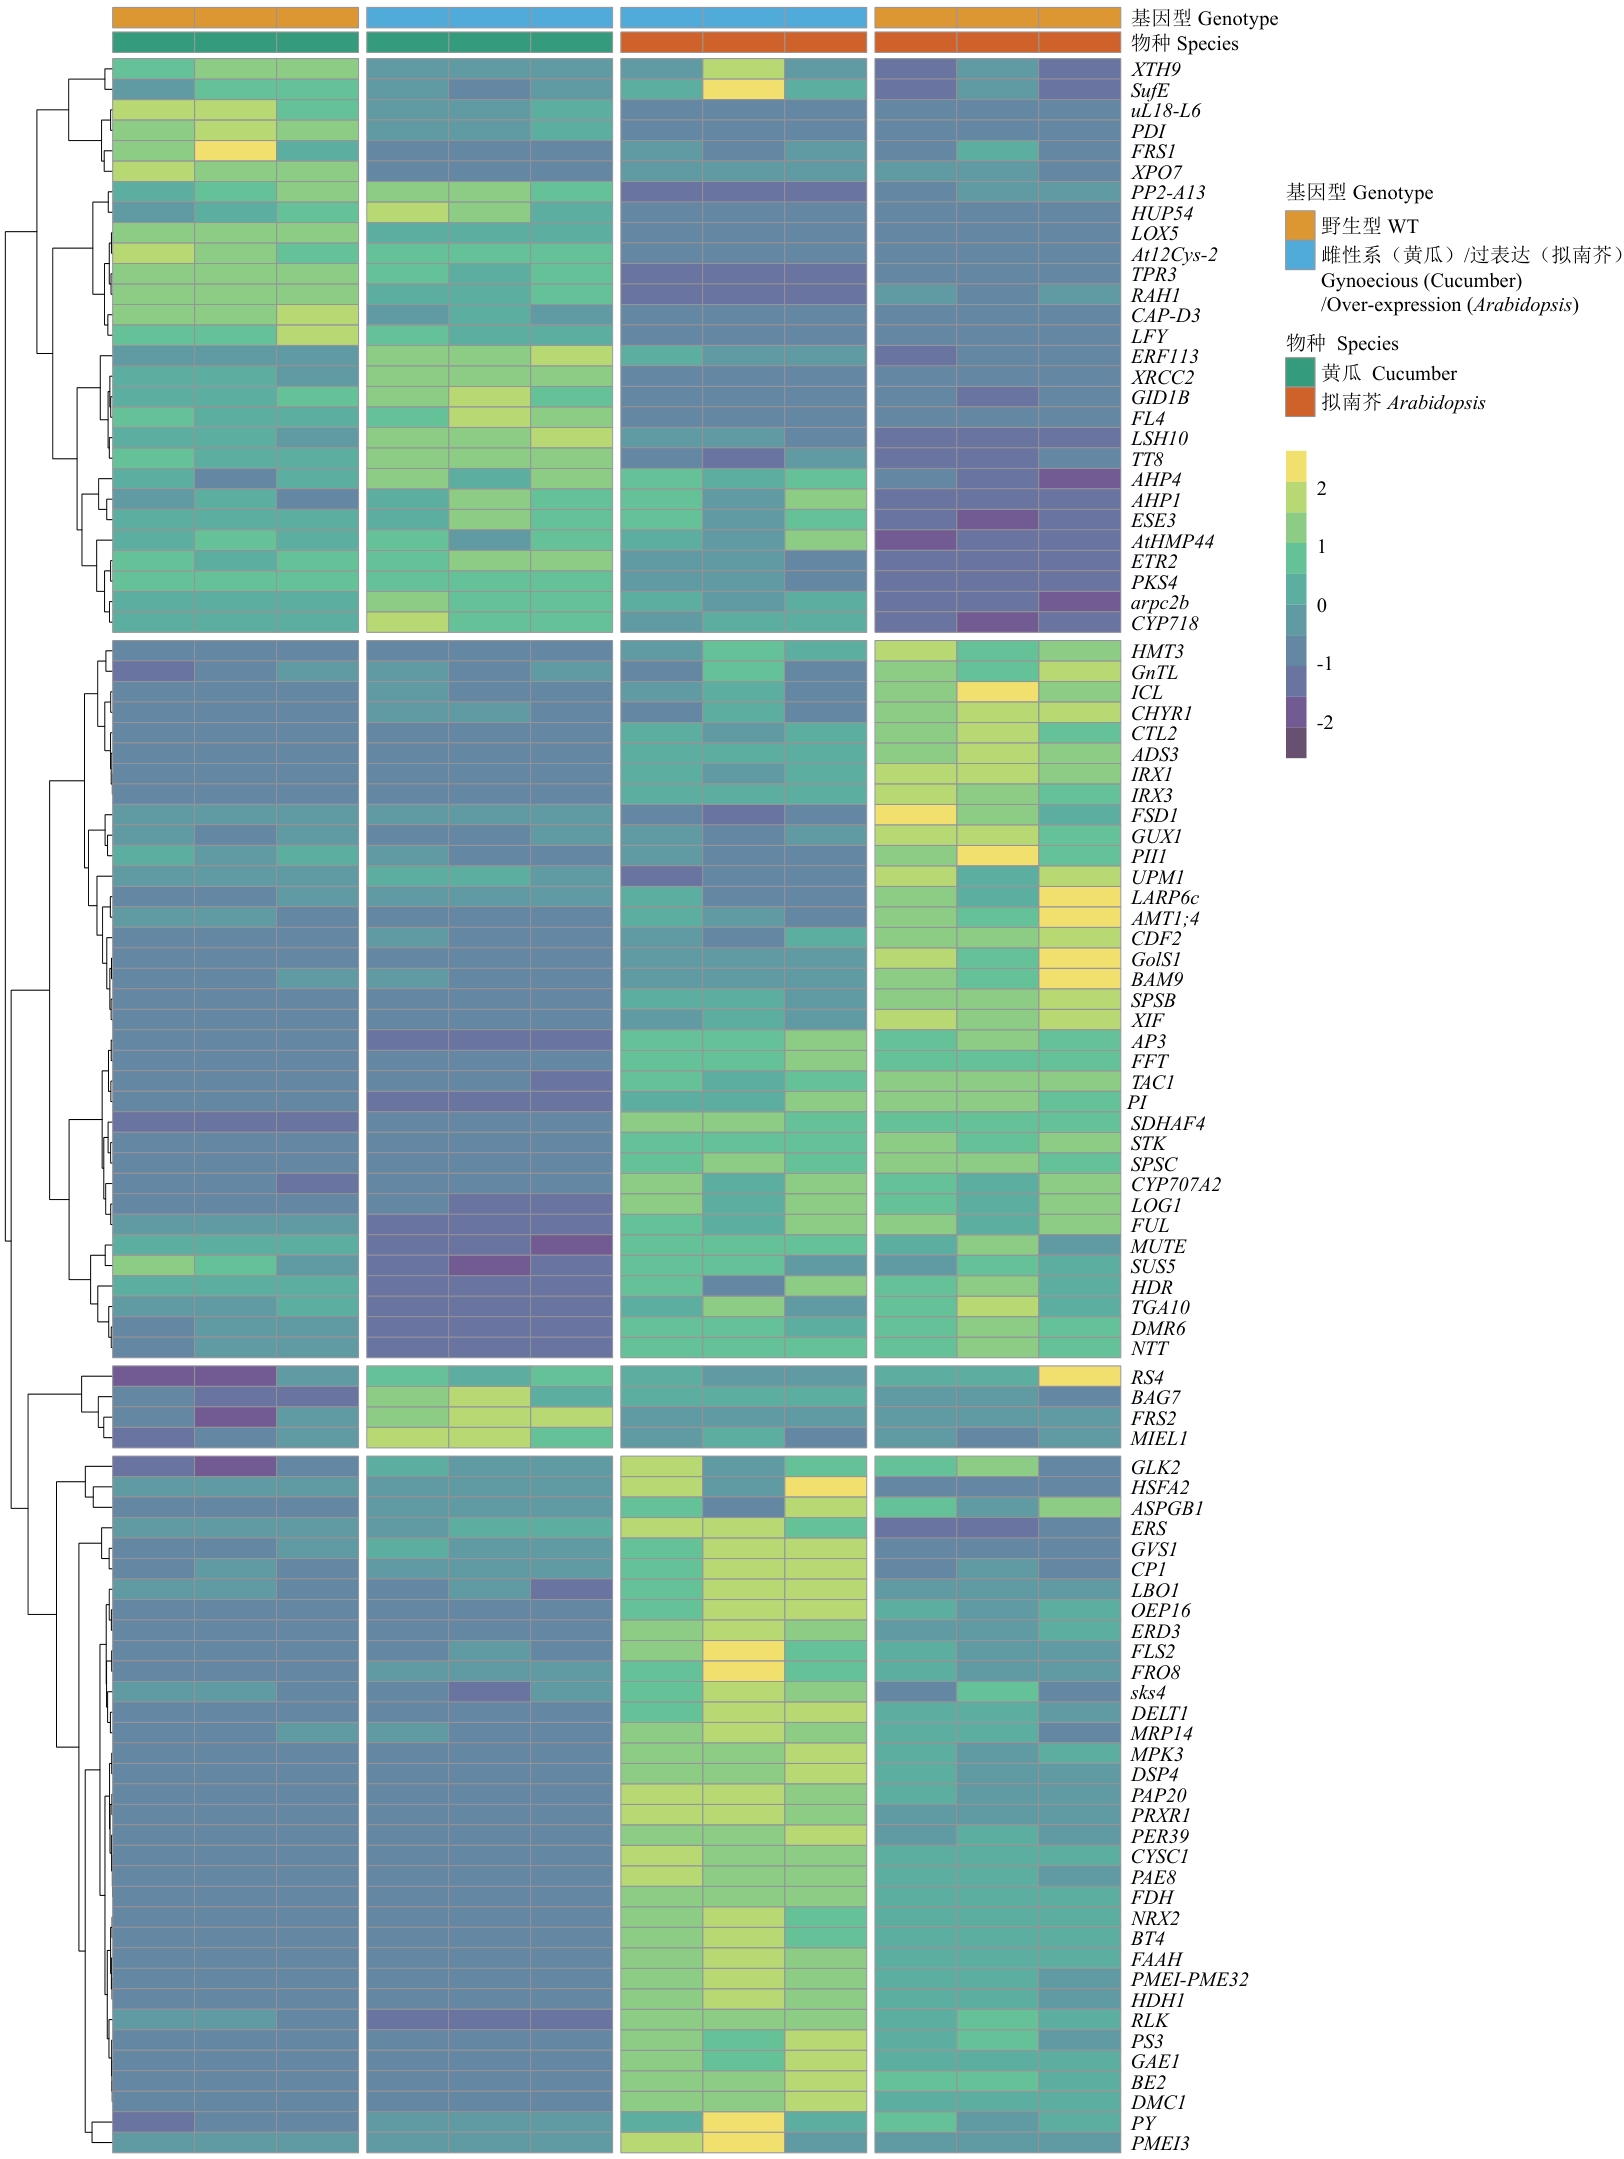
图4 黄瓜和拟南芥关键基因的表达热图分析热图展示了在黄瓜和拟南芥中差异表达并且有基因符号注释的101个基因表达模式;每1行代表1个基因,颜色表示基因表达水平的变化:黄色表示上调表达,蓝色表示下调表达;基因按照其表达模式聚类排列;右侧注释栏显示物种来源和基因型;每1行(即每个基因)的FPKM值进行Z-score标准化
Fig. 4 Expression heatmap analysis of key genes in cucumber and ArabidopsisThe heatmap displays the expression patterns of 101 differentially expressed genes with gene symbol annotations in cucumber and Arabidopsis. Each row indicates a gene, and the colors indicate changes in gene expression levels: yellow indicates upregulated expression, while blue indicates downregulated expression. The genes are clustered based on their expression patterns. The annotation bar on the right shows the species origin and genotype. The FPKM values of each row (i.e., each gene) are normalized to Z-score scale
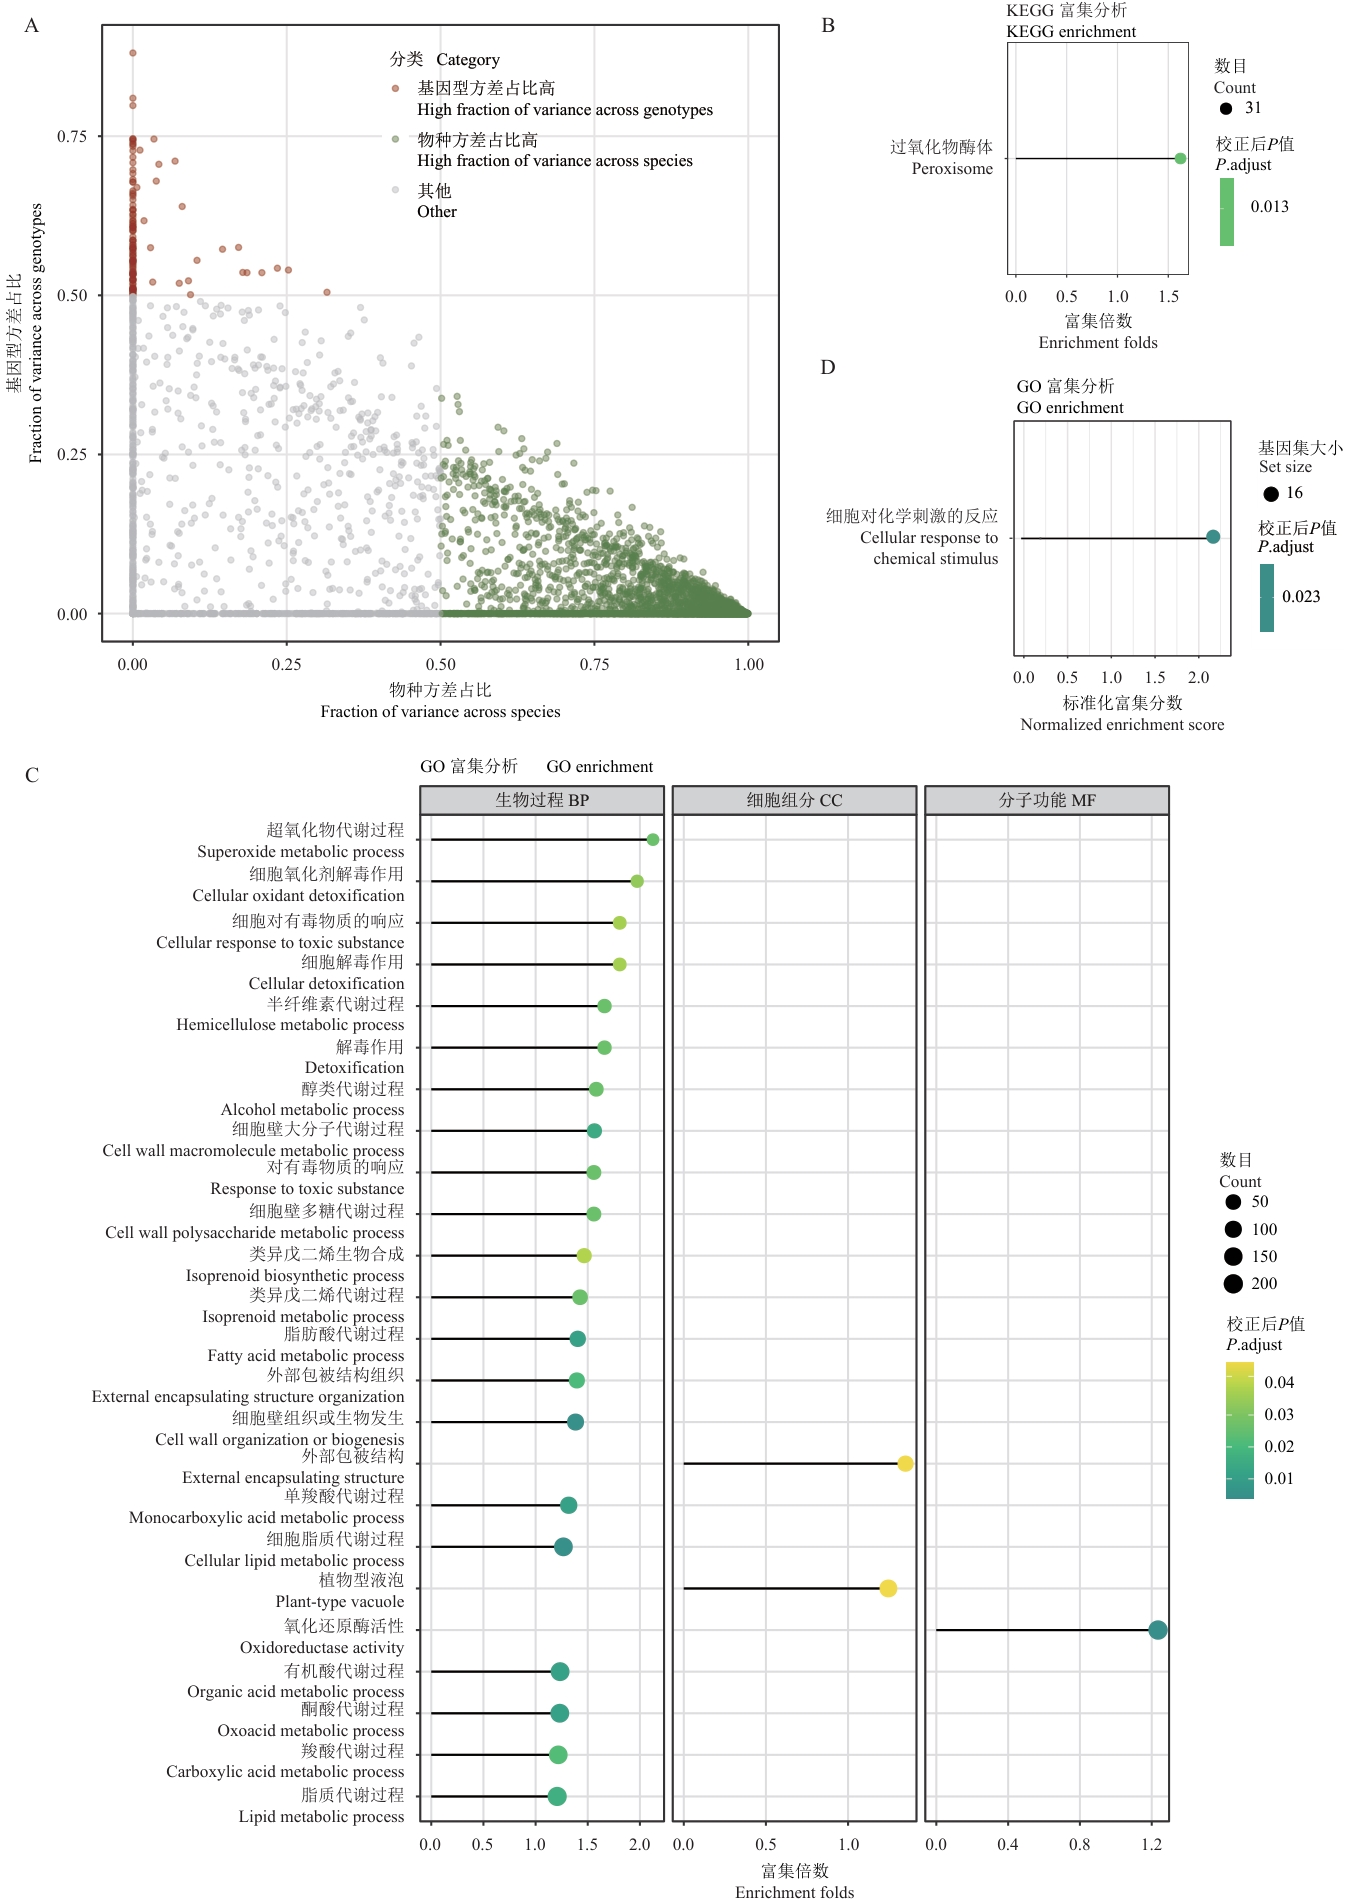
图5 物种和基因型特异性基因的功能分析A:基因表达方差分布图;X轴表示物种间方差占比,Y轴表示基因型间方差占比;点的颜色表示不同类别:基因型方差占比高(红色)、物种方差占比高(绿色)和其他(灰色);B:受基因型效应调控的基因KEGG通路富集分析结果;气泡大小表示基因数目,颜色深浅表示校正后P值,X轴表示富集倍数;C:受基因型效应调控的基因GO功能富集分析结果;气泡大小表示基因数目,颜色深浅表示校正后P值,X轴表示富集倍数;D:受基因型效应调控的基因GSEA富集分析结果;气泡大小表示基因数目,颜色表示校正后P值,X轴标准化富集分数(NES)
Fig. 5 Functional analysis of species- and genotype-specific genesA: Vriance distribution plot of gene expression. The X-axis indicates the fraction of variance across species, while the Y-axis indicates the fraction of variance across genotypes. The color of the points indicates different categories: high genotype variance proportion (red), high species variance proportion (green), and others (gray). B: KEGG pathway enrichment analysis results for genes regulated by genotype effects. The size of the bubbles indicates the number of genes, and the color intensity indicates the adjusted P-value. The X-axis indicates the enrichment fold change. C: GO functional enrichment analysis results for genes regulated by genotype effects. The size of the bubbles indicates the number of genes, and the color intensity indicates the adjusted P-value. The X-axis indicates the enrichment fold change. D: GSEA enrichment analysis results for genes regulated by genotype effects. The size of the bubbles indicates the number of genes set, the color indicates the adjusted P-value, and the X-axis indicates the normalized enrichment score (NES)
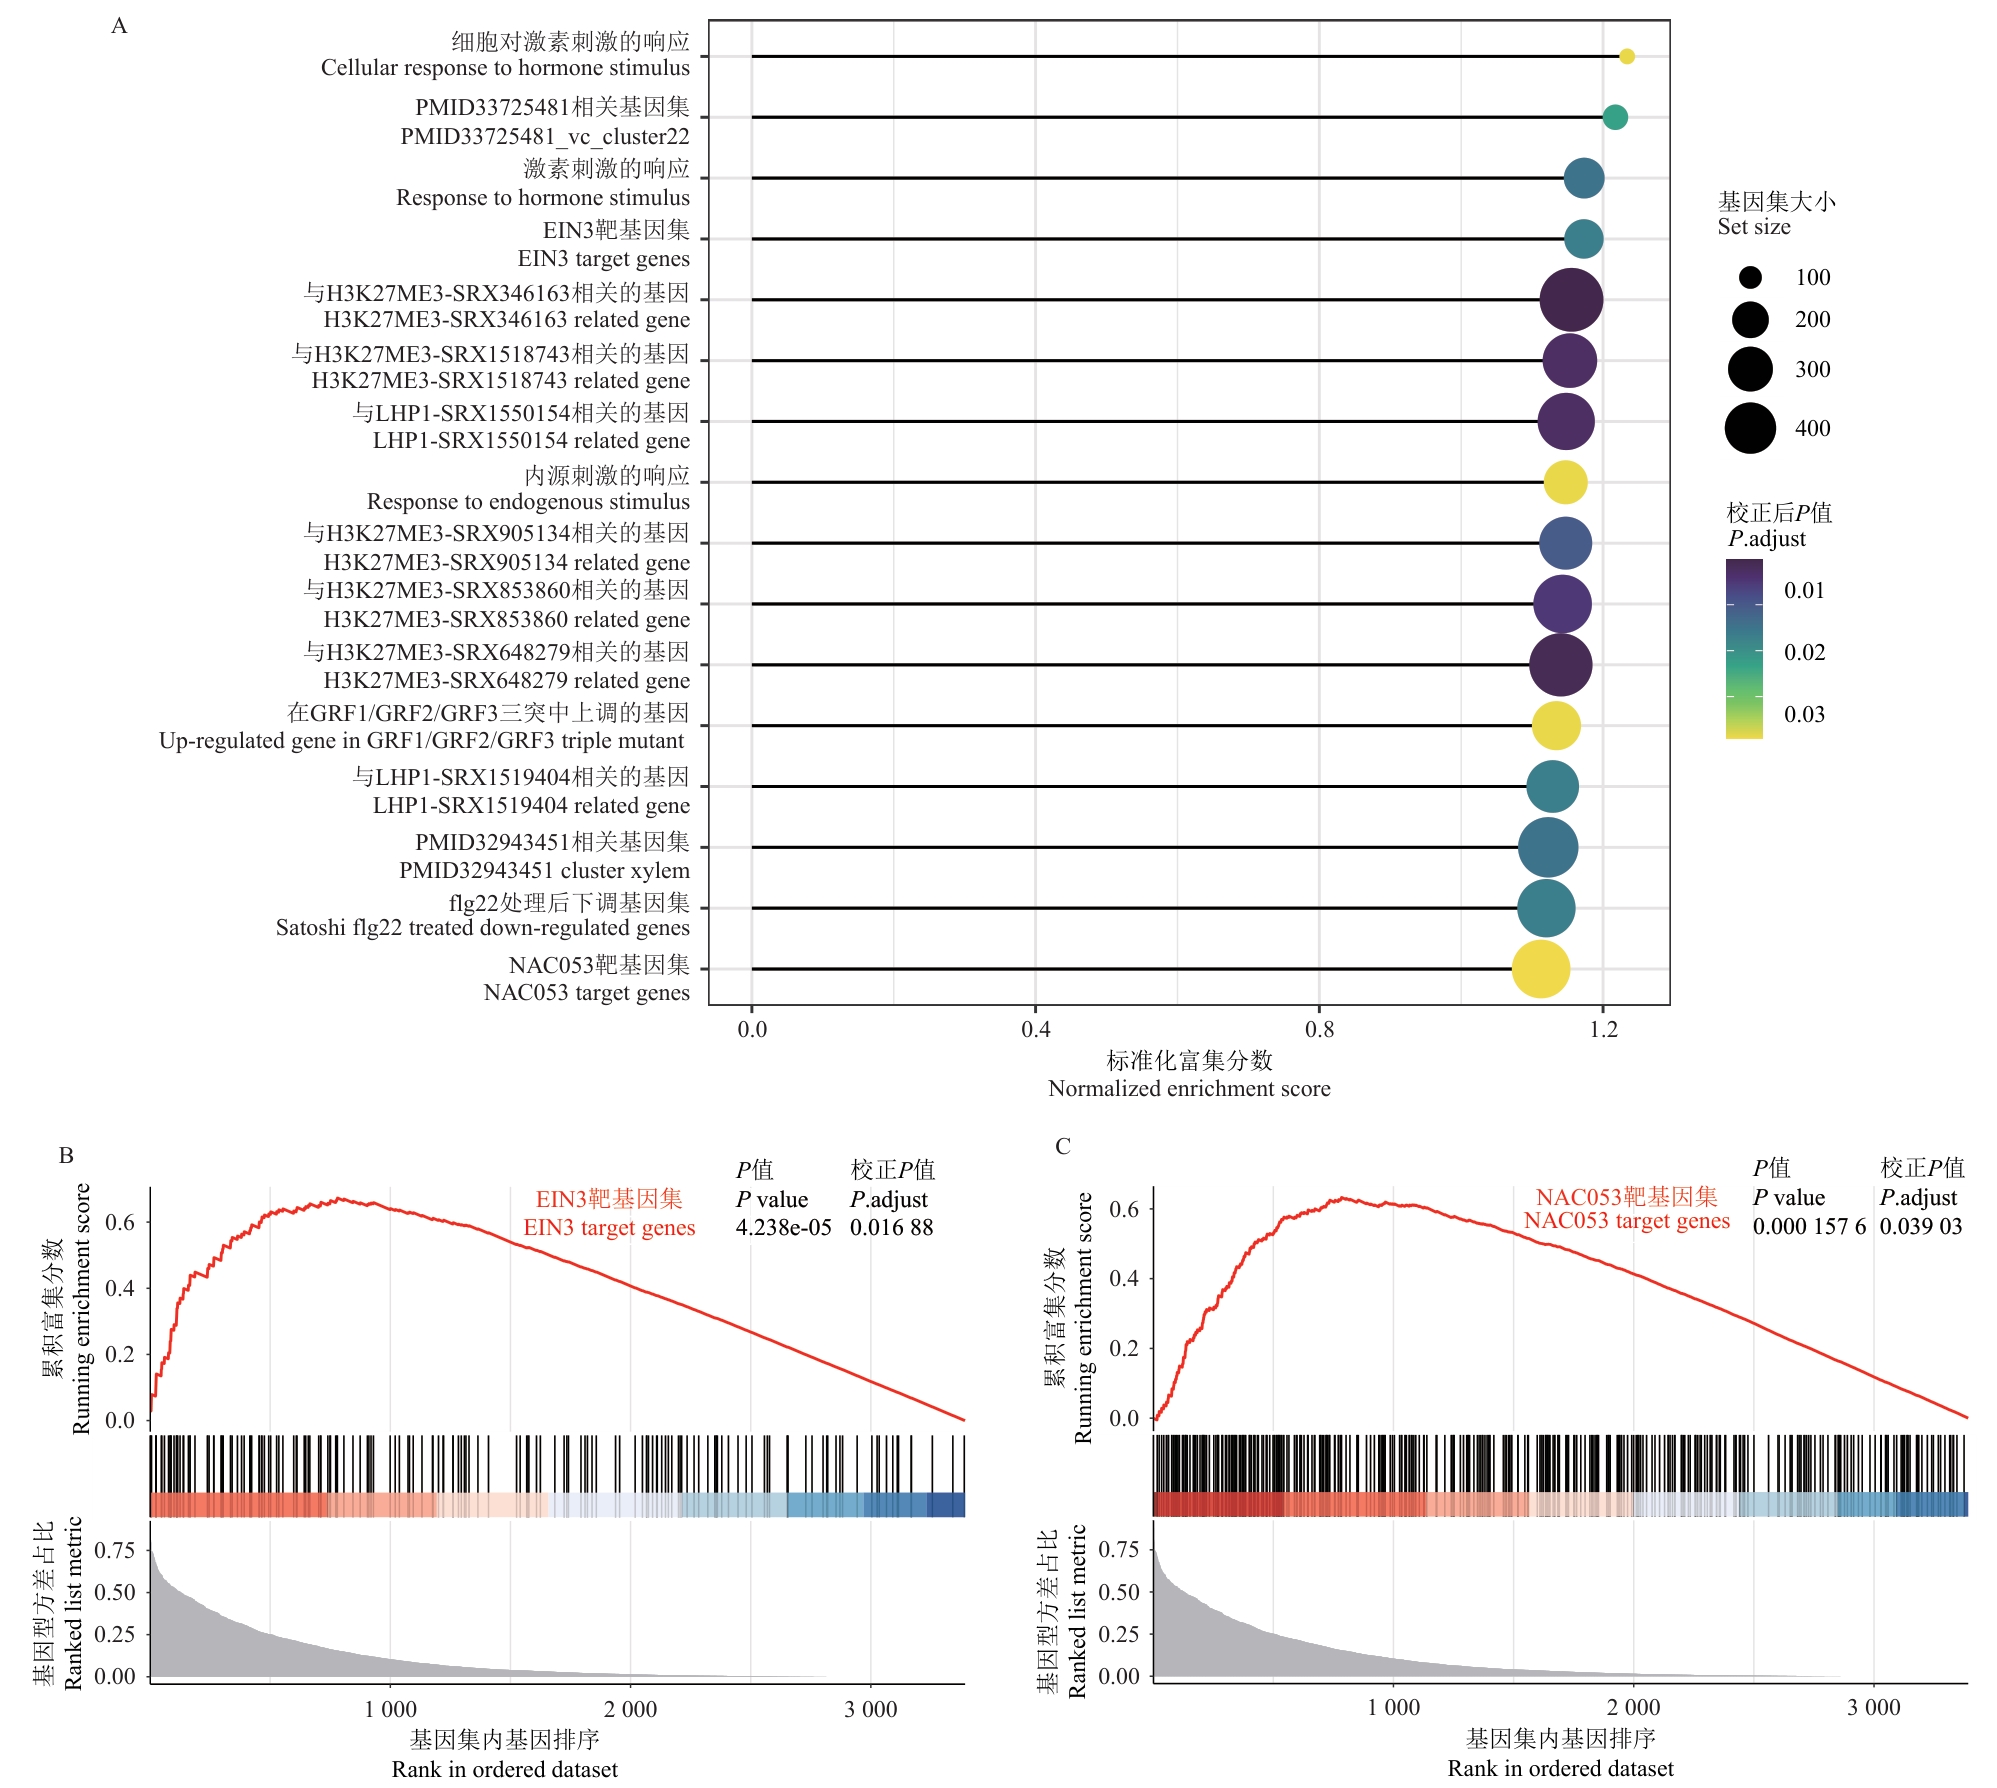
图6 PlantGSAD基因集富集分析A:受基因型效应调控的基因PlantGSAD基因集富集分析结果;棒棒糖图展示了显著富集的PlantGSAD基因集,气泡大小表示基因集大小,颜色深浅表示校正后P值,X轴表示标准化富集分数;B:EIN3靶基因集的富集分析结果;上方面板显示累积富集分数,下方面板展示基因在基因型方差占比排序中的分布;C:NAC053靶基因集的富集分析结果;同样展示了累积富集分数和基因分布图
Fig. 6 Gene set enrichment analysis of PlantGSADA: Enrichment analysis results for PlantGSAD gene sets regulated by genotype effects. The lollipop chart displays significantly enriched PlantGSAD gene sets, where the size of a bubble indicates the size of the gene sets, the color intensity indicates the adjusted P-value, and the X-axis indicates the normalized enrichment score. B: Enrichment analysis results for the EIN3 target gene set. The upper panel shows the running enrichment score, while the lower panel displays the distribution of genes in the ranking of genotype variance proportions. C: Enrichment analysis results for the NAC053 target gene set. It similarly displays the running enrichment score and the gene distribution plot
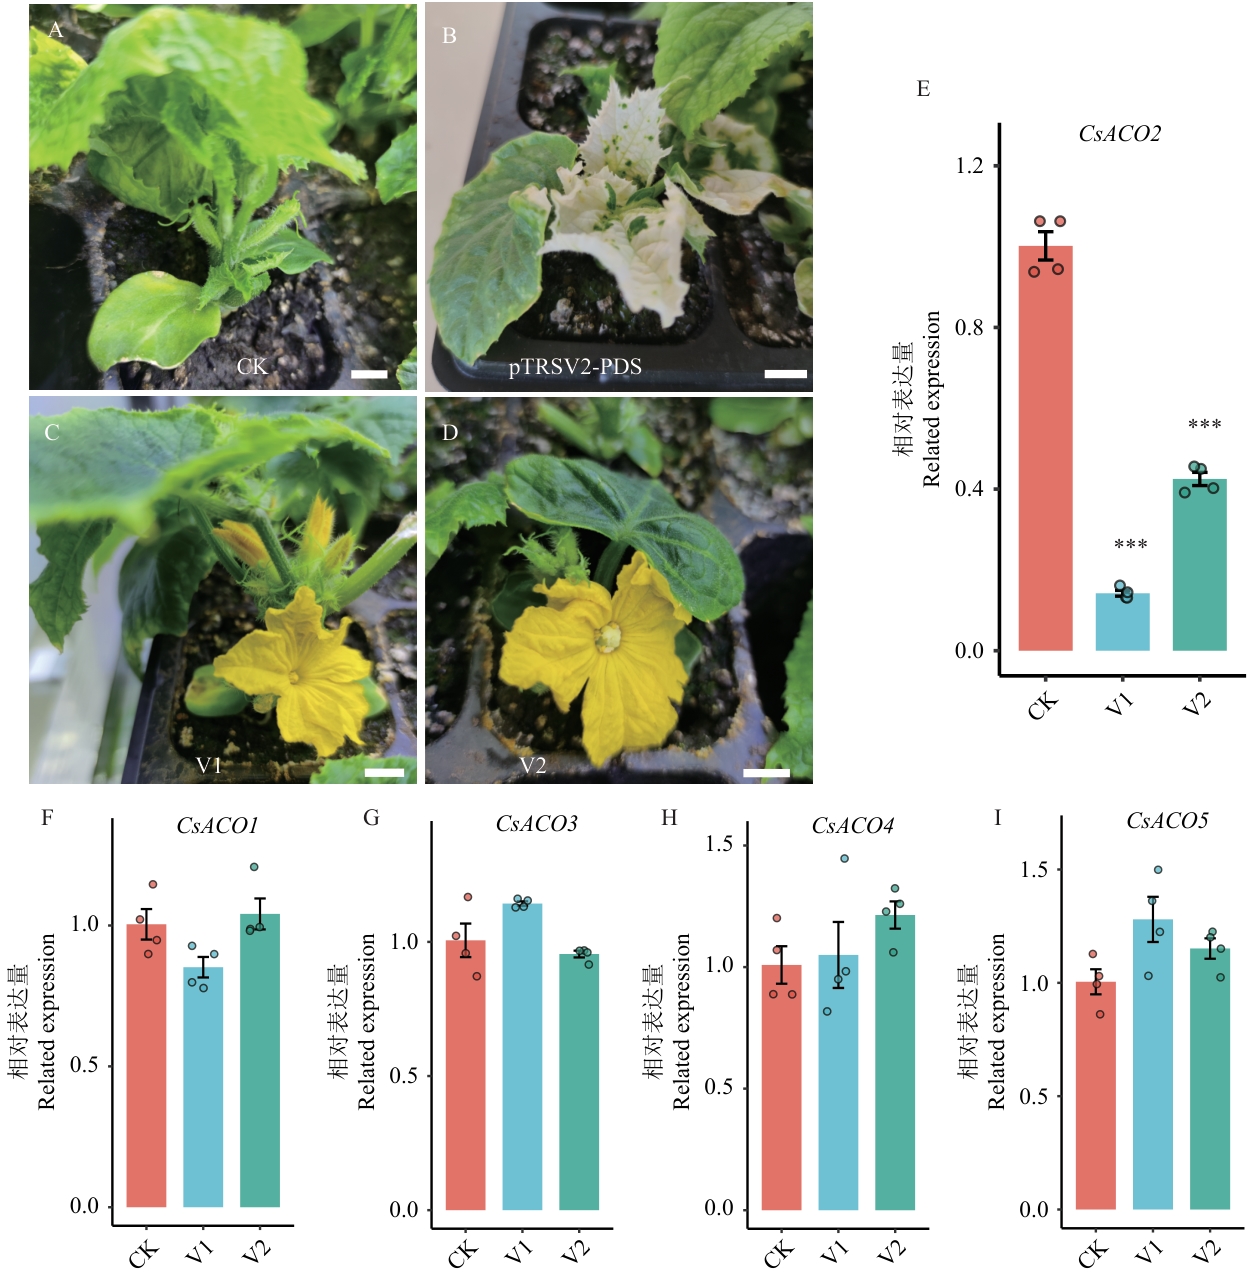
图7 黄瓜雌性系CsACO2基因的VIGS分析A:阴性对照(pTRSV2-空载体,CK),侵染后的雌性系黄瓜(X8g)只产生正常的雌花;B:阳性对照(pTRSV2-PDS),侵染后X8g植株的真叶出现明显的光漂白(白化)现象,证明VIGS系统有效;C:沉默CsACO2(pTRSV2-CsACO2, V1),侵染后的X8g植株上出现了雄花;D:沉默CsACO2(pTRSV2-CsACO2, V2),侵染后的X8g植株上出现了两性花;标尺=1 cm;E‒I:RT-qPCR检测结果显示CsACO2基因在沉默植株中表达显著下调,而其他ACO家族成员(CsACO1、CsACO3、CsACO4、CsACO5)表达无显著变化;CK:空载体对照;V1、V2:2个独立的CsACO2沉默植株;柱状图显示相对表达量(平均值±标准差),*** P<0.001
Fig. 7 VIGS analysis of the CsACO2 gene in gynoecious cucumberA: Negative control (pTRSV2-empty vector), in which the infected gynoecious cucumber (X8g) plant produces only normal female flowers. B: Positive control (pTRSV2-PDS), in which the leaves of the infected X8g plant show significant photobleaching, indicating the VIGS system is working. C: Silencing of CsACO2 (pTRSV2-CsACO2) induces the formation of male flowers on the infected X8g plant. D: Silencing of CsACO2 (pTRSV2-CsACO2) induces the formation of bisexual flowers on the infected X8g plant. Scale bar=1 cm. E‒I: RT-qPCR results showing significant downregulation of CsACO2 gene in silenced plants, while other ACO family members (CsACO1, CsACO3, CsACO4, CsACO5) showed no significant changes. CK: Empty vector control; V1, V2: two independent CsACO2-silenced plants. Bar charts show relative expression levels (mean±SD), ***P<0.001
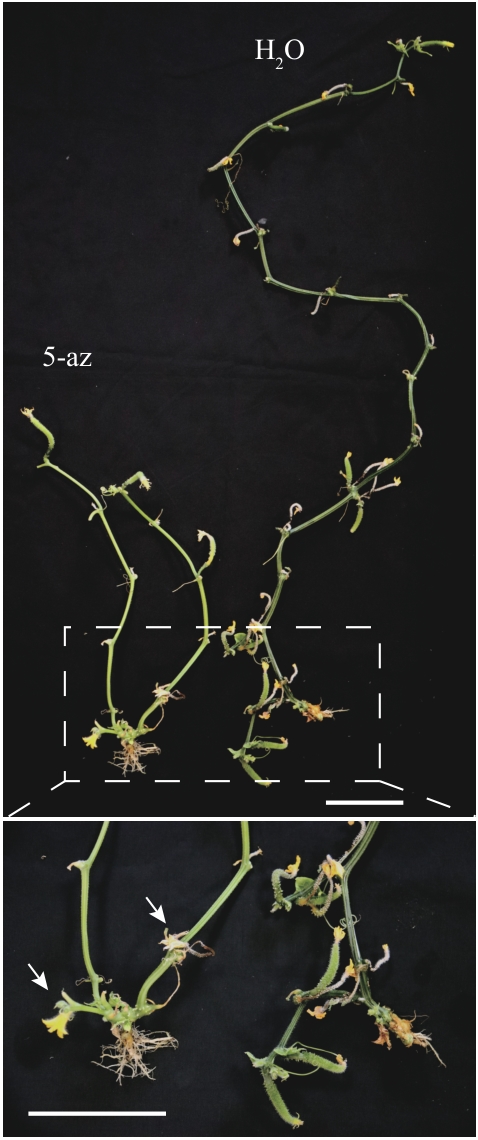
图8 DNA甲基化抑制剂5-氮杂胞苷化学处理黄瓜雌性系展示了5-azacytidine处理组(5-az)与对照组(H2O)的表型差异。对照组的雌性系X8g植株正常生长并开出雌花,而经过5-az处理的植株产生了雄花。标尺=10 cm
Fig. 8 Chemical treatment of gynoecious cucumber with the DNA methylation inhibitor 5-azacytidinePhenotypic difference between the 5-azacytidine treatment group (5-az) and control group (H2O). The control gynoecious X8g plant grows normally and produces female flowers, whereas the 5-az-treated plant produces male flowers. Scale bar=10 cm
| [1] | Zhang SQ, Tan FQ, Chung CH, et al. The control of carpel determinacy pathway leads to sex determination in cucurbits [J]. Science, 2022, 378(6619): 543-549. |
| [2] | Zheng JK, Xia R. Flower development and sex determination in horticultural crops [J]. Fruit Res, 2022, 2(1): 1-9. |
| [3] | Luo HY, Zhang HC, Wang HS. Advance in sex differentiation in cucumber [J]. Front Plant Sci, 2023, 14: 1186904. |
| [4] | Aparna, Skarzyńska A, Pląder W, et al. Impact of climate change on regulation of genes involved in sex determination and fruit production in cucumber [J]. Plants, 2023, 12(14): 2651. |
| [5] | Bai SN, Xu ZH. Unisexual cucumber flowers, sex and sex differentiation [J]. Int Rev Cell Mol Biol, 2013, 304: 1-55. |
| [6] | 杨森, 魏爱民, 杜胜利, 等. 黄瓜性别分化的化学调控技术研究进展 [J]. 中国瓜菜, 2009, 22(6): 31-34. |
| Yang S, Wei AM, Du SL, et al. Development of chemical regulation of cucumber sex differentiation research [J]. China Cucurbits Veg, 2009, 22(6): 31-34. | |
| [7] | Turek S, Aparna, Skarzyńska A, et al. Understanding transcription factors and how they affect processes in cucumber sex determination [J]. Metabolites, 2023, 13(6): 740. |
| [8] | Bai SL, Peng YB, Cui JX, et al. Developmental analyses reveal early arrests of the spore-bearing parts of reproductive organs in unisexual flowers of cucumber (Cucumis sativus L.) [J]. Planta, 2004, 220(2): 230-240. |
| [9] | Dong ZN, Liu XL, Guo X, et al. Developmental innovation of inferior ovaries and flower sex orchestrated by KNOX1 in cucurbits [J]. Nat Plants, 2025, 11(4): 861-877. |
| [10] | Hao YJ, Wang DH, Peng YB, et al. DNA damage in the early primordial anther is closely correlated with stamen arrest in the female flower of cucumber (Cucumis sativus L.) [J]. Planta, 2003, 217(6): 888-895. |
| [11] | Martin A, Troadec C, Boualem A, et al. A transposon-induced epigenetic change leads to sex determination in melon [J]. Nature, 2009, 461(7267): 1135-1138. |
| [12] | Hu BW, Li DW, Liu X, et al. Engineering non-transgenic gynoecious cucumber using an improved transformation protocol and optimized CRISPR/Cas9 system [J]. Mol Plant, 2017, 10(12): 1575-1578. |
| [13] | Boualem A, Troadec C, Camps C, et al. A cucurbit androecy gene reveals how unisexual flowers develop and dioecy emerges [J]. Science, 2015, 350(6261): 688-691. |
| [14] | Zhang HM, Li S, Yang L, et al. Gain-of-function of the 1-aminocyclopropane-1-carboxylate synthase gene ACS1G induces female flower development in cucumber gynoecy [J]. Plant Cell, 2021, 33(2): 306-321. |
| [15] | Knopf RR, Trebitsh T. The female-specific Cs-ACS1G gene of cucumber. A case of gene duplication and recombination between the non-sex-specific 1-aminocyclopropane-1-carboxylate synthase gene and a branched-chain amino acid transaminase gene [J]. Plant Cell Physiol, 2006, 47(9): 1217-1228. |
| [16] | Zhang ZH, Mao LY, Chen HM, et al. Genome-wide mapping of structural variations reveals a copy number variant that determines reproductive morphology in cucumber [J]. Plant Cell, 2015, 27(6): 1595-1604. |
| [17] | Li Z, Huang SW, Liu SQ, et al. Molecular isolation of the M gene suggests that a conserved-residue conversion induces the formation of bisexual flowers in cucumber plants [J]. Genetics, 2009, 182(4): 1381-1385. |
| [18] | Li Z, Wang S, Tao QY, et al. A putative positive feedback regulation mechanism in CsACS2 expression suggests a modified model for sex determination in cucumber (Cucumis sativus L.) [J]. J Exp Bot, 2012, 63(12): 4475-4484. |
| [19] | Niu HH, Wang H, Zhao BS, et al. Exogenous auxin-induced enhancer of shoot regeneration 2 (ESR2) enhances femaleness of cucumber via activating CsACS2 gene [J]. Hortic Res, 2022, 9: uhab085. |
| [20] | Tan JY, Tao QY, Niu HH, et al. A novel allele of monoecious (m) locus is responsible for elongated fruit shape and perfect flowers in cucumber (Cucumis sativus L.) [J]. Theor Appl Genet, 2015, 128(12): 2483-2493. |
| [21] | Xin TX, Zhang Z, Li S, et al. Genetic regulation of ethylene dosage for cucumber fruit elongation [J]. Plant Cell, 2019, 31(5): 1063-1076. |
| [22] | Yang ZH, Li LB, Meng ZJ, et al. Constitutive expression of cucumber CsACS2 in Arabidopsis thaliana disrupts anther dehiscence through ethylene signaling and DNA methylation pathways [J]. Plant Cell Rep, 2024, 43(12): 288. |
| [23] | Bolger AM, Lohse M, Usadel B. Trimmomatic: a flexible trimmer for Illumina sequence data [J]. Bioinformatics, 2014, 30(15): 2114-2120. |
| [24] | Kim D, Langmead B, Salzberg SL. HISAT: a fast spliced aligner with low memory requirements [J]. Nat Methods, 2015, 12(4): 357-360. |
| [25] | Li Q, Li HB, Huang W, et al. A chromosome-scale genome assembly of cucumber (Cucumis sativus L.) [J]. Gigascience, 2019, 8(6): giz072. |
| [26] | Love MI, Huber W, Anders S. Moderated estimation of fold change and dispersion for RNA-seq data with DESeq2 [J]. Genome Biol, 2014, 15(12): 550. |
| [27] | Wu TZ, Hu EQ, Xu SB, et al. clusterProfiler 4.0: a universal enrichment tool for interpreting omics data [J]. Innovation, 2021, 2(3): 100141. |
| [28] | Ma XL, Yan HY, Yang JT, et al. PlantGSAD: a comprehensive gene set annotation database for plant species [J]. Nucleic Acids Res, 2022, 50(D1): D1456-D1467. |
| [29] | Emms DM, Kelly S. OrthoFinder: phylogenetic orthology inference for comparative genomics [J]. Genome Biol, 2019, 20(1): 238. |
| [30] | Yue F, Cheng Y, Breschi A, et al. A comparative encyclopedia of DNA elements in the mouse genome [J]. Nature, 2014, 515(7527): 355-364. |
| [31] | Fang L, Wei XY, Liu LZ, et al. A tobacco ringspot virus-based vector system for gene and microRNA function studies in cucurbits [J]. Plant Physiol, 2021, 186(2): 853-864. |
| [32] | Dong MM, Xue SD, Bartholomew ES, et al. Transcriptomic and functional analysis provides molecular insights into multicellular trichome development [J]. Plant Physiol, 2022, 189(1): 301-314. |
| [33] | Chen HM, Sun JJ, Li S, et al. An ACC oxidase gene essential for cucumber carpel development [J]. Mol Plant, 2016, 9(9): 1315-1327. |
| [34] | Rashid D, Devani RS, Rodriguez-Granados NY, et al. Ethylene produced in carpel primordia controls CmHB40 expression to inhibit stamen development [J]. Nat Plants, 2023, 9(10): 1675-1687. |
| [35] | Huang HY, Zhang SQ, Abou Choucha F, et al. Harbinger transposon insertion in ethylene signaling gene leads to emergence of new sexual forms in cucurbits [J]. Nat Commun, 2024, 15(1): 4877. |
| [36] | Li CX, Dong SY, Liu XP, et al. Co-domestication of cold tolerance and female flower is determined by CsEIN2 in cucumber [J]. Plant Biotechnol J, 2025. DOI: 10.1111/pbi.70195 . |
| [37] | 牛欢欢. 黄瓜乙烯响应因子ERFs参与性别决定过程的调控研究 [D]. 杨凌: 西北农林科技大学, 2021. |
| Niu HH. Research on the regulation of cucumber ethylene-responsive factors ERFs participate in the sex determination process [D]. Yangling: Northwest A & F University, 2021. | |
| [38] | Zhou GZ, Yin HY, Chen F, et al. The genome of Areca catechu provides insights into sex determination of monoecious plants [J]. New Phytol, 2022, 236(6): 2327-2343. |
| [39] | Zhang C, Xiong AT, Ren MY, et al. An epigenetically mediated double negative cascade from EFD to HB21 regulates anther development [J]. Nat Commun, 2024, 15(1): 7796. |
| [40] | Li YL, Chen M, Khan AH, et al. Histone H3 lysine 27 trimethylation suppresses jasmonate biosynthesis and signaling to affect male fertility under high temperature in cotton [J]. Plant Commun, 2023, 4(6): 100660. |
| [1] | 王芳, 邵会茹, 吕林龙, 赵点, 胡振, 吕建珍, 姜亮. 植物和细菌TurboID邻近蛋白标记方法的建立[J]. 生物技术通报, 2025, 41(9): 44-53. |
| [2] | 李雅琼, 格桑拉毛, 陈启迪, 杨宇环, 何花转, 赵耀飞. 异源过表达高粱SbSnRK2.1增强拟南芥对盐胁迫的抗性[J]. 生物技术通报, 2025, 41(8): 115-123. |
| [3] | 王斌, 李健荣, 占朝霞, 袁晓. CsGR-RBP3克隆及其在采后黄瓜耐冷性中的功能[J]. 生物技术通报, 2025, 41(6): 155-166. |
| [4] | 张勇, 宋盛龙, 李永泰, 张新宇, 李艳军. 陆地棉GhSWEET9基因的克隆及抗黄萎病功能分析[J]. 生物技术通报, 2025, 41(6): 144-154. |
| [5] | 刘彤彤, 李肖慧, 杨骏龙, 陈旺, 玉猛, 王超凡, 王凤茹, 客绍英. ZmSTART1调控玉米维管束建成的功能研究[J]. 生物技术通报, 2025, 41(4): 115-122. |
| [6] | 杨涛, 李琳, 莫小连, 陈晓龙, 王健, 黄园, 赵杰宏, 邹颉. 铁皮石斛DoDELLA2的功能研究[J]. 生物技术通报, 2025, 41(12): 240-253. |
| [7] | 郭浩杰, 王成, 杨馥熔, 杜冰, 孟超敏. 谷子SiSPX9基因的克隆及耐低磷分析[J]. 生物技术通报, 2025, 41(12): 114-123. |
| [8] | 桑世博, 李俐, 张枫源, 孙朗, 谌能双, 程聪, 任燕萍, 马丽, 张桦. TRV介导的梭梭基因沉默体系构建与验证[J]. 生物技术通报, 2025, 41(11): 212-220. |
| [9] | 田栩瑞, 霍信屹, 郭云涵, 向林, 产祝龙, 王艳平. 百合LoSAUR10基因的表达特征及功能分析[J]. 生物技术通报, 2025, 41(1): 221-229. |
| [10] | 林彤, 袁程, 董陈文华, 曾孟琼, 杨燕, 毛自朝, 林春. 藜麦配子发育相关基因CqSTK的筛选及功能分析[J]. 生物技术通报, 2024, 40(8): 83-94. |
| [11] | 范宗强, 冯靖涵, 郑丽雪, 王硕, 彭向前, 陈芳. 枯草芽孢杆菌B579对黄瓜枯萎病的防治及其诱导抗性研究[J]. 生物技术通报, 2024, 40(7): 226-234. |
| [12] | 胡永波, 雷雨田, 杨永森, 陈馨, 林黄昉, 林碧英, 刘爽, 毕格, 申宝营. 黄瓜和南瓜Bcl-2相关抗凋亡家族全基因组鉴定与表达模式分析[J]. 生物技术通报, 2024, 40(6): 219-237. |
| [13] | 李景艳, 周家婧, 袁媛, 苏晓艺, 乔文慧, 薛岩磊, 李国婧, 王瑞刚. 拟南芥AtiPGAM2基因参与非生物胁迫的响应[J]. 生物技术通报, 2024, 40(5): 215-224. |
| [14] | 陈春林, 李白雪, 李金玲, 杜清洁, 李猛, 肖怀娟. 甜瓜CmEPF基因家族的鉴定及表达分析[J]. 生物技术通报, 2024, 40(4): 130-138. |
| [15] | 肖雅茹, 贾婷婷, 罗丹, 武喆, 李丽霞. 黄瓜CsERF025L转录因子的克隆及表达分析[J]. 生物技术通报, 2024, 40(4): 159-166. |
| 阅读次数 | ||||||
|
全文 |
|
|||||
|
摘要 |
|
|||||