


Biotechnology Bulletin ›› 2025, Vol. 41 ›› Issue (12): 139-155.doi: 10.13560/j.cnki.biotech.bull.1985.2025-0571
Previous Articles Next Articles
YANG Zong-hui1( ), LI Li-bin1, MENG Zhao-juan1, GAO Tian2, ZHU Li-xia3, DU Hai-mei4, DONG Wei-wei5, CAO Qi-wei1()
Received:2025-06-03
Online:2025-12-26
Published:2026-01-06
Contact:
CAO Qi-wei
E-mail:ksprings@163.com;qiweicao1979@163.com
YANG Zong-hui, LI Li-bin, MENG Zhao-juan, GAO Tian, ZHU Li-xia, DU Hai-mei, DONG Wei-wei, CAO Qi-wei. Comparative Transcriptomics Reveals Synergistic Control of Cucumber Sex Determination by Ethylene Signaling and Epigenetic Regulation[J]. Biotechnology Bulletin, 2025, 41(12): 139-155.
样本编号 Sample ID | 清洁读数 Clean reads | 清洁碱基数 Clean bases (bp) | GC 含量 GC content (%) | Q30 碱基比例 Q30 (%) |
|---|---|---|---|---|
| T01 | 25 139 532 | 7 511 087 362 | 44.41 | 93.75 |
| T02 | 23 678 722 | 7 068 974 554 | 44.57 | 93.75 |
| T03 | 29 026 750 | 8 662 561 328 | 44.31 | 94.09 |
| T04 | 31 798 263 | 9 491 036 146 | 44.43 | 93.77 |
| T05 | 26 566 141 | 7 941 970 238 | 44.24 | 93.74 |
| T06 | 28 078 078 | 8 390 027 920 | 44.29 | 93.69 |
Table 1 Basic statistics of sequencing data
样本编号 Sample ID | 清洁读数 Clean reads | 清洁碱基数 Clean bases (bp) | GC 含量 GC content (%) | Q30 碱基比例 Q30 (%) |
|---|---|---|---|---|
| T01 | 25 139 532 | 7 511 087 362 | 44.41 | 93.75 |
| T02 | 23 678 722 | 7 068 974 554 | 44.57 | 93.75 |
| T03 | 29 026 750 | 8 662 561 328 | 44.31 | 94.09 |
| T04 | 31 798 263 | 9 491 036 146 | 44.43 | 93.77 |
| T05 | 26 566 141 | 7 941 970 238 | 44.24 | 93.74 |
| T06 | 28 078 078 | 8 390 027 920 | 44.29 | 93.69 |
样本编号 Sample ID | 总读数 Total reads | 比对读数 Mapped reads | 唯一比对读数 Uniquely mapped reads | 多重比对读数 Multi-mapped reads | 正链比对读数 Mapped reads on+strand | 负链比对读数 Mapped reads on-strand |
|---|---|---|---|---|---|---|
| T01 | 50 279 064 | 48 741 549 (96.94%) | 47 020 390 (93.52%) | 1 721 159 (3.42%) | 24 142 446 | 24 233 782 |
| T02 | 47 357 444 | 45 842 026 (96.80%) | 44 215 419 (93.37%) | 1 626 607 (3.43%) | 22 699 707 | 22 792 183 |
| T03 | 58 053 500 | 56 296 505 (96.97%) | 54 317 173 (93.56%) | 1 979 332 (3.41%) | 27 877 852 | 27 989 891 |
| T04 | 63 596 526 | 61 603 424 (96.87%) | 59 470 279 (93.51%) | 2 133 145 (3.35%) | 30 511 057 | 30 629 863 |
| T05 | 53 132 282 | 51 558 779 (97.04%) | 49 751 449 (93.64%) | 1 807 330 (3.40%) | 25 547 018 | 25 635 938 |
| T06 | 56 156 156 | 54 471 955 (97.00%) | 52 558 943 (93.59%) | 1 913 012 (3.41%) | 26 972 777 | 27 079 418 |
Table 2 Statistics of mapping results
样本编号 Sample ID | 总读数 Total reads | 比对读数 Mapped reads | 唯一比对读数 Uniquely mapped reads | 多重比对读数 Multi-mapped reads | 正链比对读数 Mapped reads on+strand | 负链比对读数 Mapped reads on-strand |
|---|---|---|---|---|---|---|
| T01 | 50 279 064 | 48 741 549 (96.94%) | 47 020 390 (93.52%) | 1 721 159 (3.42%) | 24 142 446 | 24 233 782 |
| T02 | 47 357 444 | 45 842 026 (96.80%) | 44 215 419 (93.37%) | 1 626 607 (3.43%) | 22 699 707 | 22 792 183 |
| T03 | 58 053 500 | 56 296 505 (96.97%) | 54 317 173 (93.56%) | 1 979 332 (3.41%) | 27 877 852 | 27 989 891 |
| T04 | 63 596 526 | 61 603 424 (96.87%) | 59 470 279 (93.51%) | 2 133 145 (3.35%) | 30 511 057 | 30 629 863 |
| T05 | 53 132 282 | 51 558 779 (97.04%) | 49 751 449 (93.64%) | 1 807 330 (3.40%) | 25 547 018 | 25 635 938 |
| T06 | 56 156 156 | 54 471 955 (97.00%) | 52 558 943 (93.59%) | 1 913 012 (3.41%) | 26 972 777 | 27 079 418 |
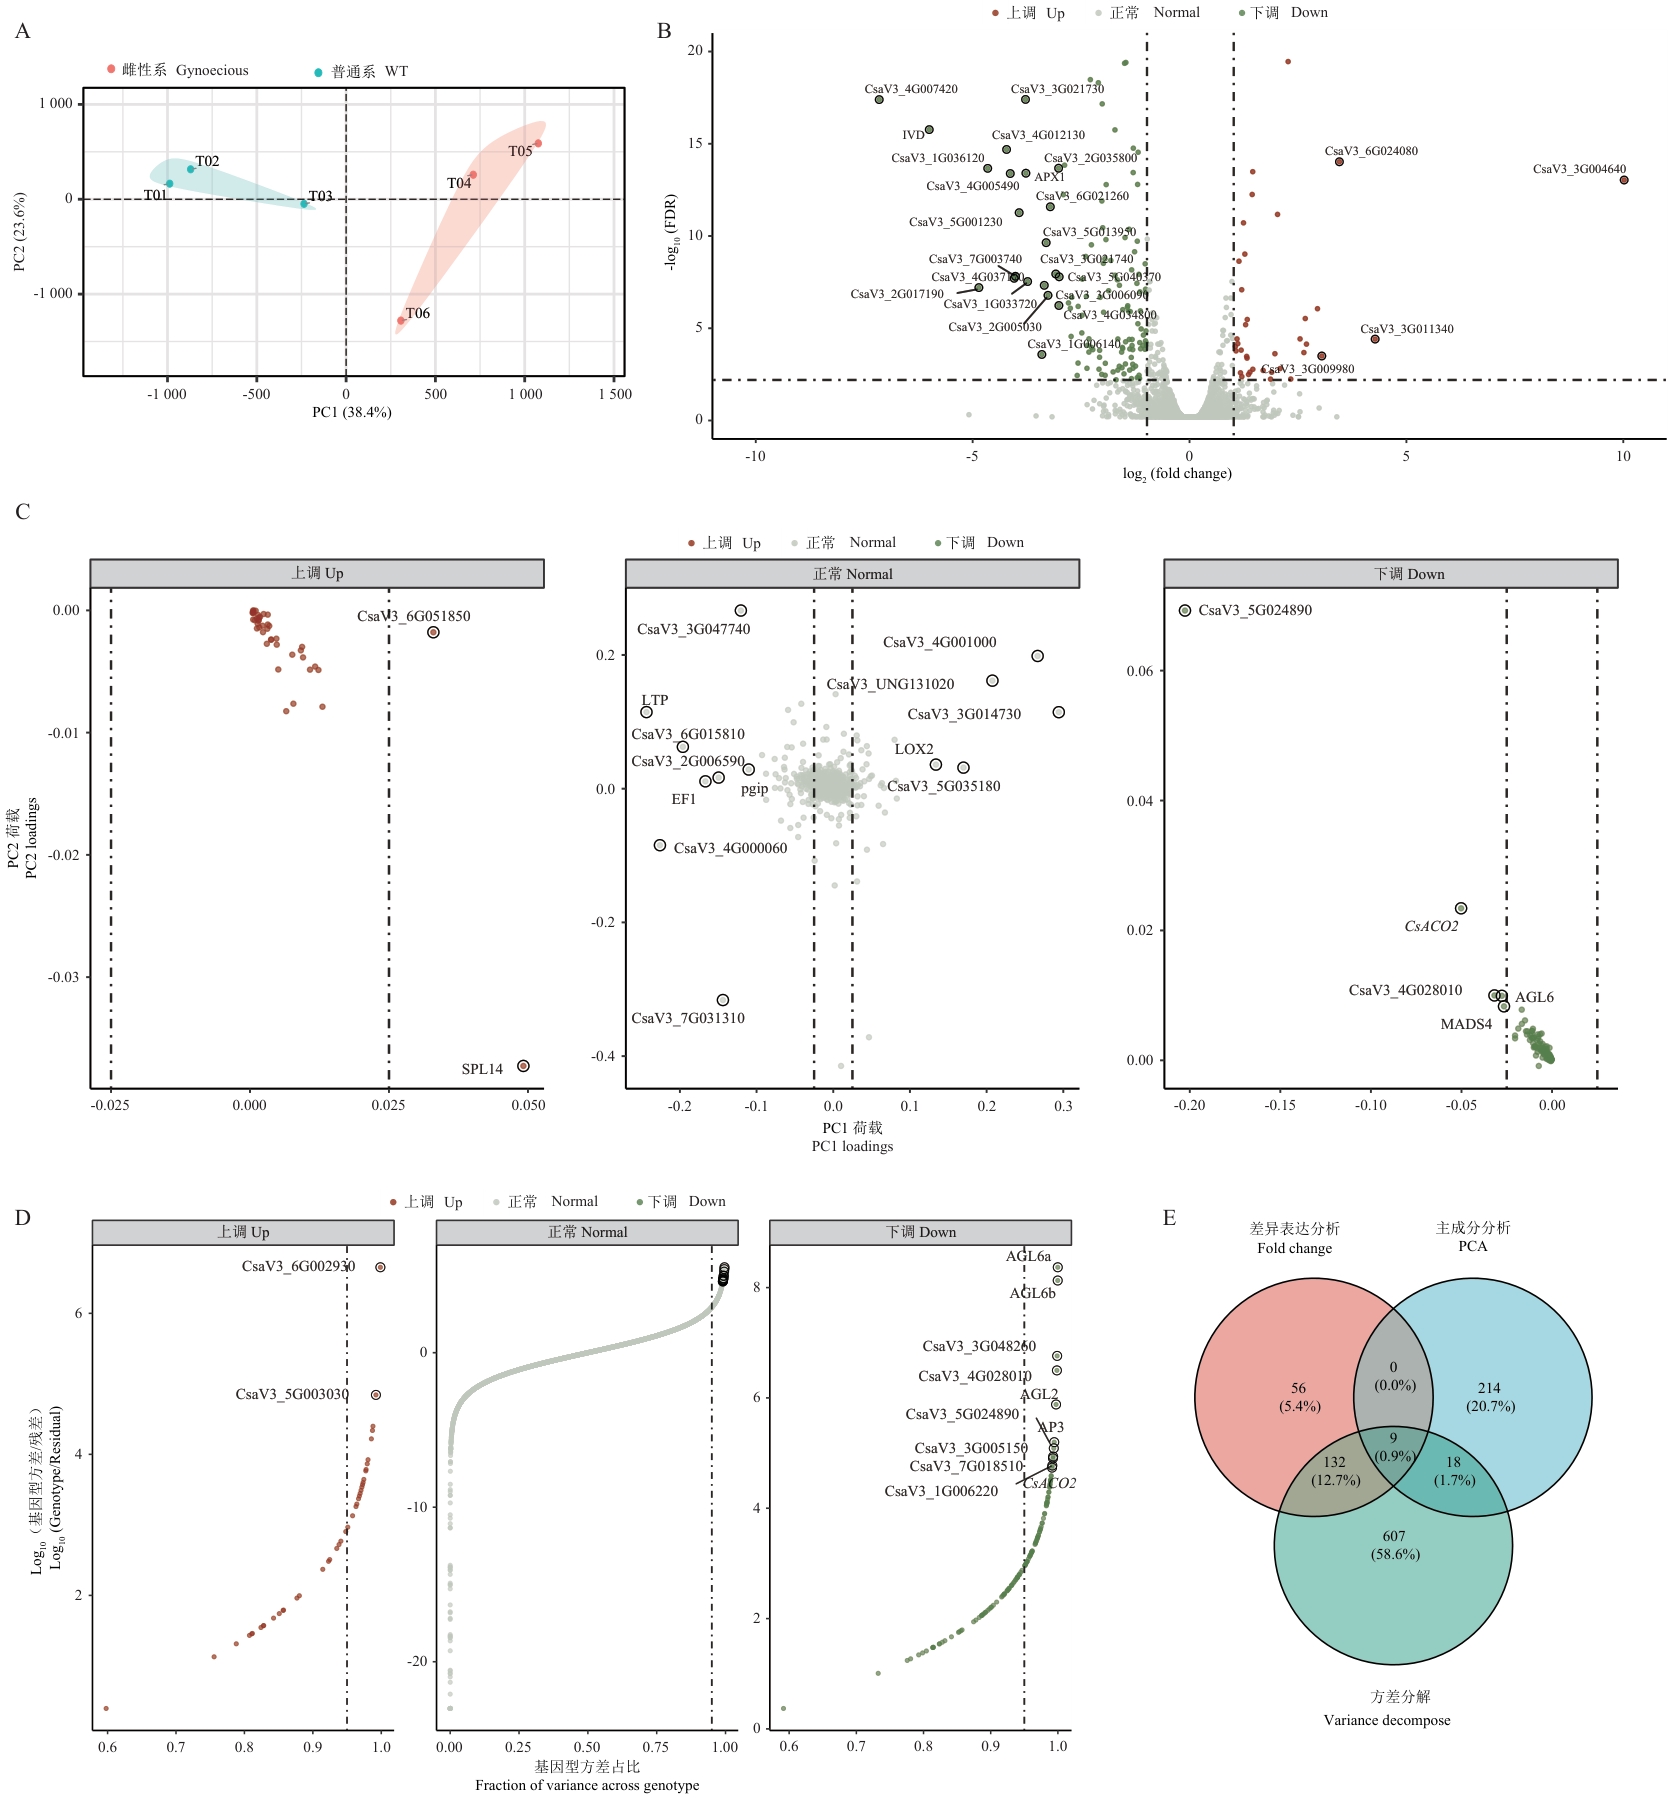
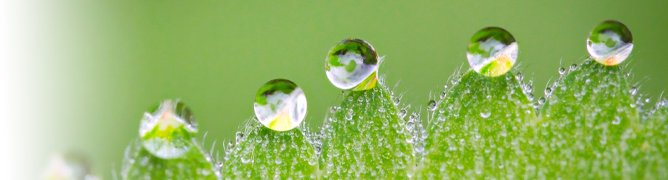
Fig. 1 Transcriptome expression pattern analysis of gynoecious and monoecious cucumber linesA: Principal component analysis (PCA) plot showing overall expression differences among samples. PC1 and PC2 explain 38.4% and 23.6% of expression variation, respectively. Colors indicate different genotypes: gynoecious (red) and monoecious (blue). B: Volcano plot showing the distribution of differentially expressed genes. Red and blue dots represent significantly up-regulated (43) and down-regulated (154) genes (|log2FC|>=1, FDR<0.01). Highlighted are the genes with a fold change in expression exceeding 3 times. C: Distribution of gene loadings on PC1 and PC2. Dot colors indicate differential expression status. Key genes with high PC1 loadings are highlighted. D: Variance decomposition analysis of gene expression. The X-axis shows the distribution of genotype variance proportions, while the Y-axis displays the logarithmic ratio of genotype variance to residuals. Highlighted are the genes with a genotype variance proportion exceeding 0.99. E: Venn diagram showing the overlap among genes identified by three screening methods (differential expression analysis, principal component analysis, and variance decomposition). Numbers indicate gene counts and percentages in each region
基因编号 Gene ID | 基因名称 Gene name | log2倍数变化 log2FC | 表达调控 Regulation | PC1载荷值 PC1 loading | 基因型方差占比 Fraction of variance across genotypes |
|---|---|---|---|---|---|
| CsaV3_2G032190 | -- | -1.23 | 下调 | -0.020 | 0.927 |
| CsaV3_3G040160 | -- | -1.74 | 下调 | -0.020 | 0.931 |
| CsaV3_4G028010 | -- | -2.43 | 下调 | -0.032 | 0.998 |
| CsaV3_4G037760 | SPL14 | 1.26 | 上调 | 0.049 | 0.938 |
| CsaV3_5G024890 | -- | -5.41 | 下调 | -0.203 | 0.994 |
| CsaV3_6G006010 | AGL6 | -1.98 | 下调 | -0.028 | 0.999 |
| CsaV3_6G008200 | MADS4 | -2.90 | 下调 | -0.027 | 0.988 |
| CsaV3_6G048630 | CsACO2 | -1.20 | 下调 | -0.050 | 0.991 |
| CsaV3_6G051850 | -- | 2.81 | 上调 | 0.033 | 0.964 |
Table 3 Key genes identified by three screening methods and their expression characteristics
基因编号 Gene ID | 基因名称 Gene name | log2倍数变化 log2FC | 表达调控 Regulation | PC1载荷值 PC1 loading | 基因型方差占比 Fraction of variance across genotypes |
|---|---|---|---|---|---|
| CsaV3_2G032190 | -- | -1.23 | 下调 | -0.020 | 0.927 |
| CsaV3_3G040160 | -- | -1.74 | 下调 | -0.020 | 0.931 |
| CsaV3_4G028010 | -- | -2.43 | 下调 | -0.032 | 0.998 |
| CsaV3_4G037760 | SPL14 | 1.26 | 上调 | 0.049 | 0.938 |
| CsaV3_5G024890 | -- | -5.41 | 下调 | -0.203 | 0.994 |
| CsaV3_6G006010 | AGL6 | -1.98 | 下调 | -0.028 | 0.999 |
| CsaV3_6G008200 | MADS4 | -2.90 | 下调 | -0.027 | 0.988 |
| CsaV3_6G048630 | CsACO2 | -1.20 | 下调 | -0.050 | 0.991 |
| CsaV3_6G051850 | -- | 2.81 | 上调 | 0.033 | 0.964 |
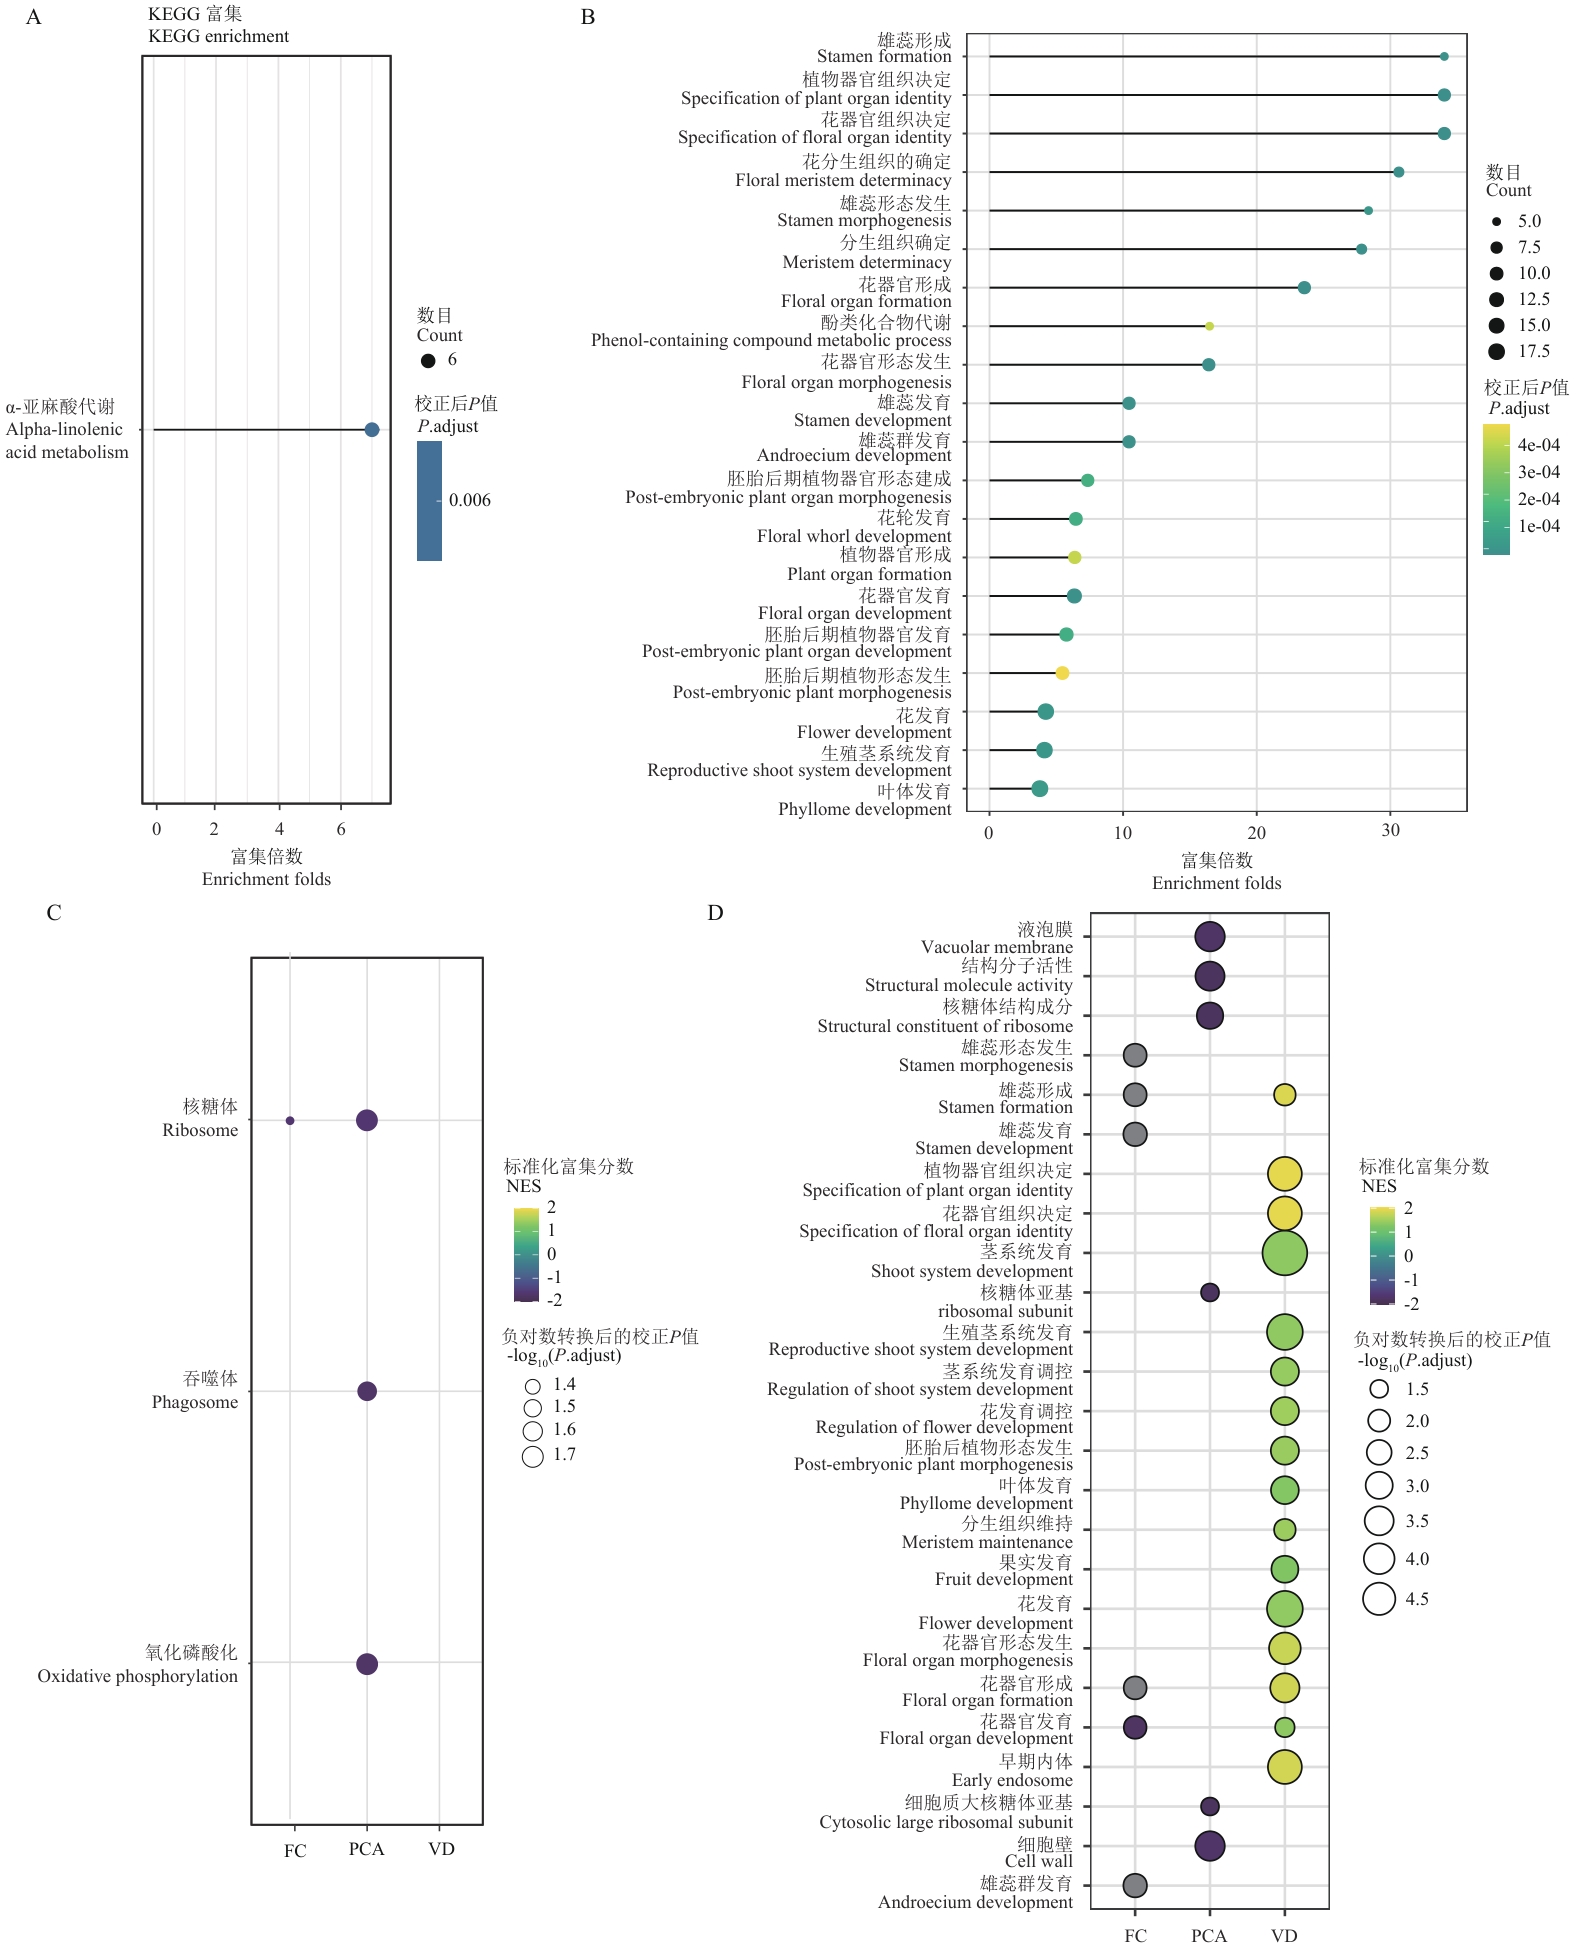
Fig. 2 Functional enrichment analysis reveals key metabolic pathways and biological processesA: KEGG pathway enrichment analysis results. Bubble size indicates the number of enriched genes, and color intensity indicates the significance level (adjusted P-value). B: GO functional enrichment analysis results. Bubble size indicates gene count, and color indicates adjusted P-value. C: Comparison of KEGG pathway enrichment based on different screening strategies. Heatmap colors indicate enrichment scores (NES), with yellow indicating positive enrichment and blue indicating negative enrichment. The size of a dot indicates the significance level [-log10(P.adjust)]. D: Comparison of GO functional enrichment for gene sets obtained from different selection strategies. The colors in the heatmap indicate the enrichment score (NES), with yellow indicating positive enrichment and blue indicating negative enrichment. The size of a dot indicates the significance level [-log10(P.adjust)]. FC: Differential expression analysis; PCA: principal component analysis; VD: variance decomposition
Fig. 3 Comparative analysis of orthologus gene expression patterns between cucumber and ArabidopsisA: Scatter plot showing expression changes of orthologous genes between cucumber and Arabidopsis. X-axis and Y-axis indicate log2FC values in cucumber and Arabidopsis, respectively. Colors indicate different expression patterns. Key genes are labeled by gene names. B: GO functional enrichment analysis of cucumber-specific differentially expressed genes. Bubble size indicates gene count, and color intensity indicates significance level (adjusted P-value)
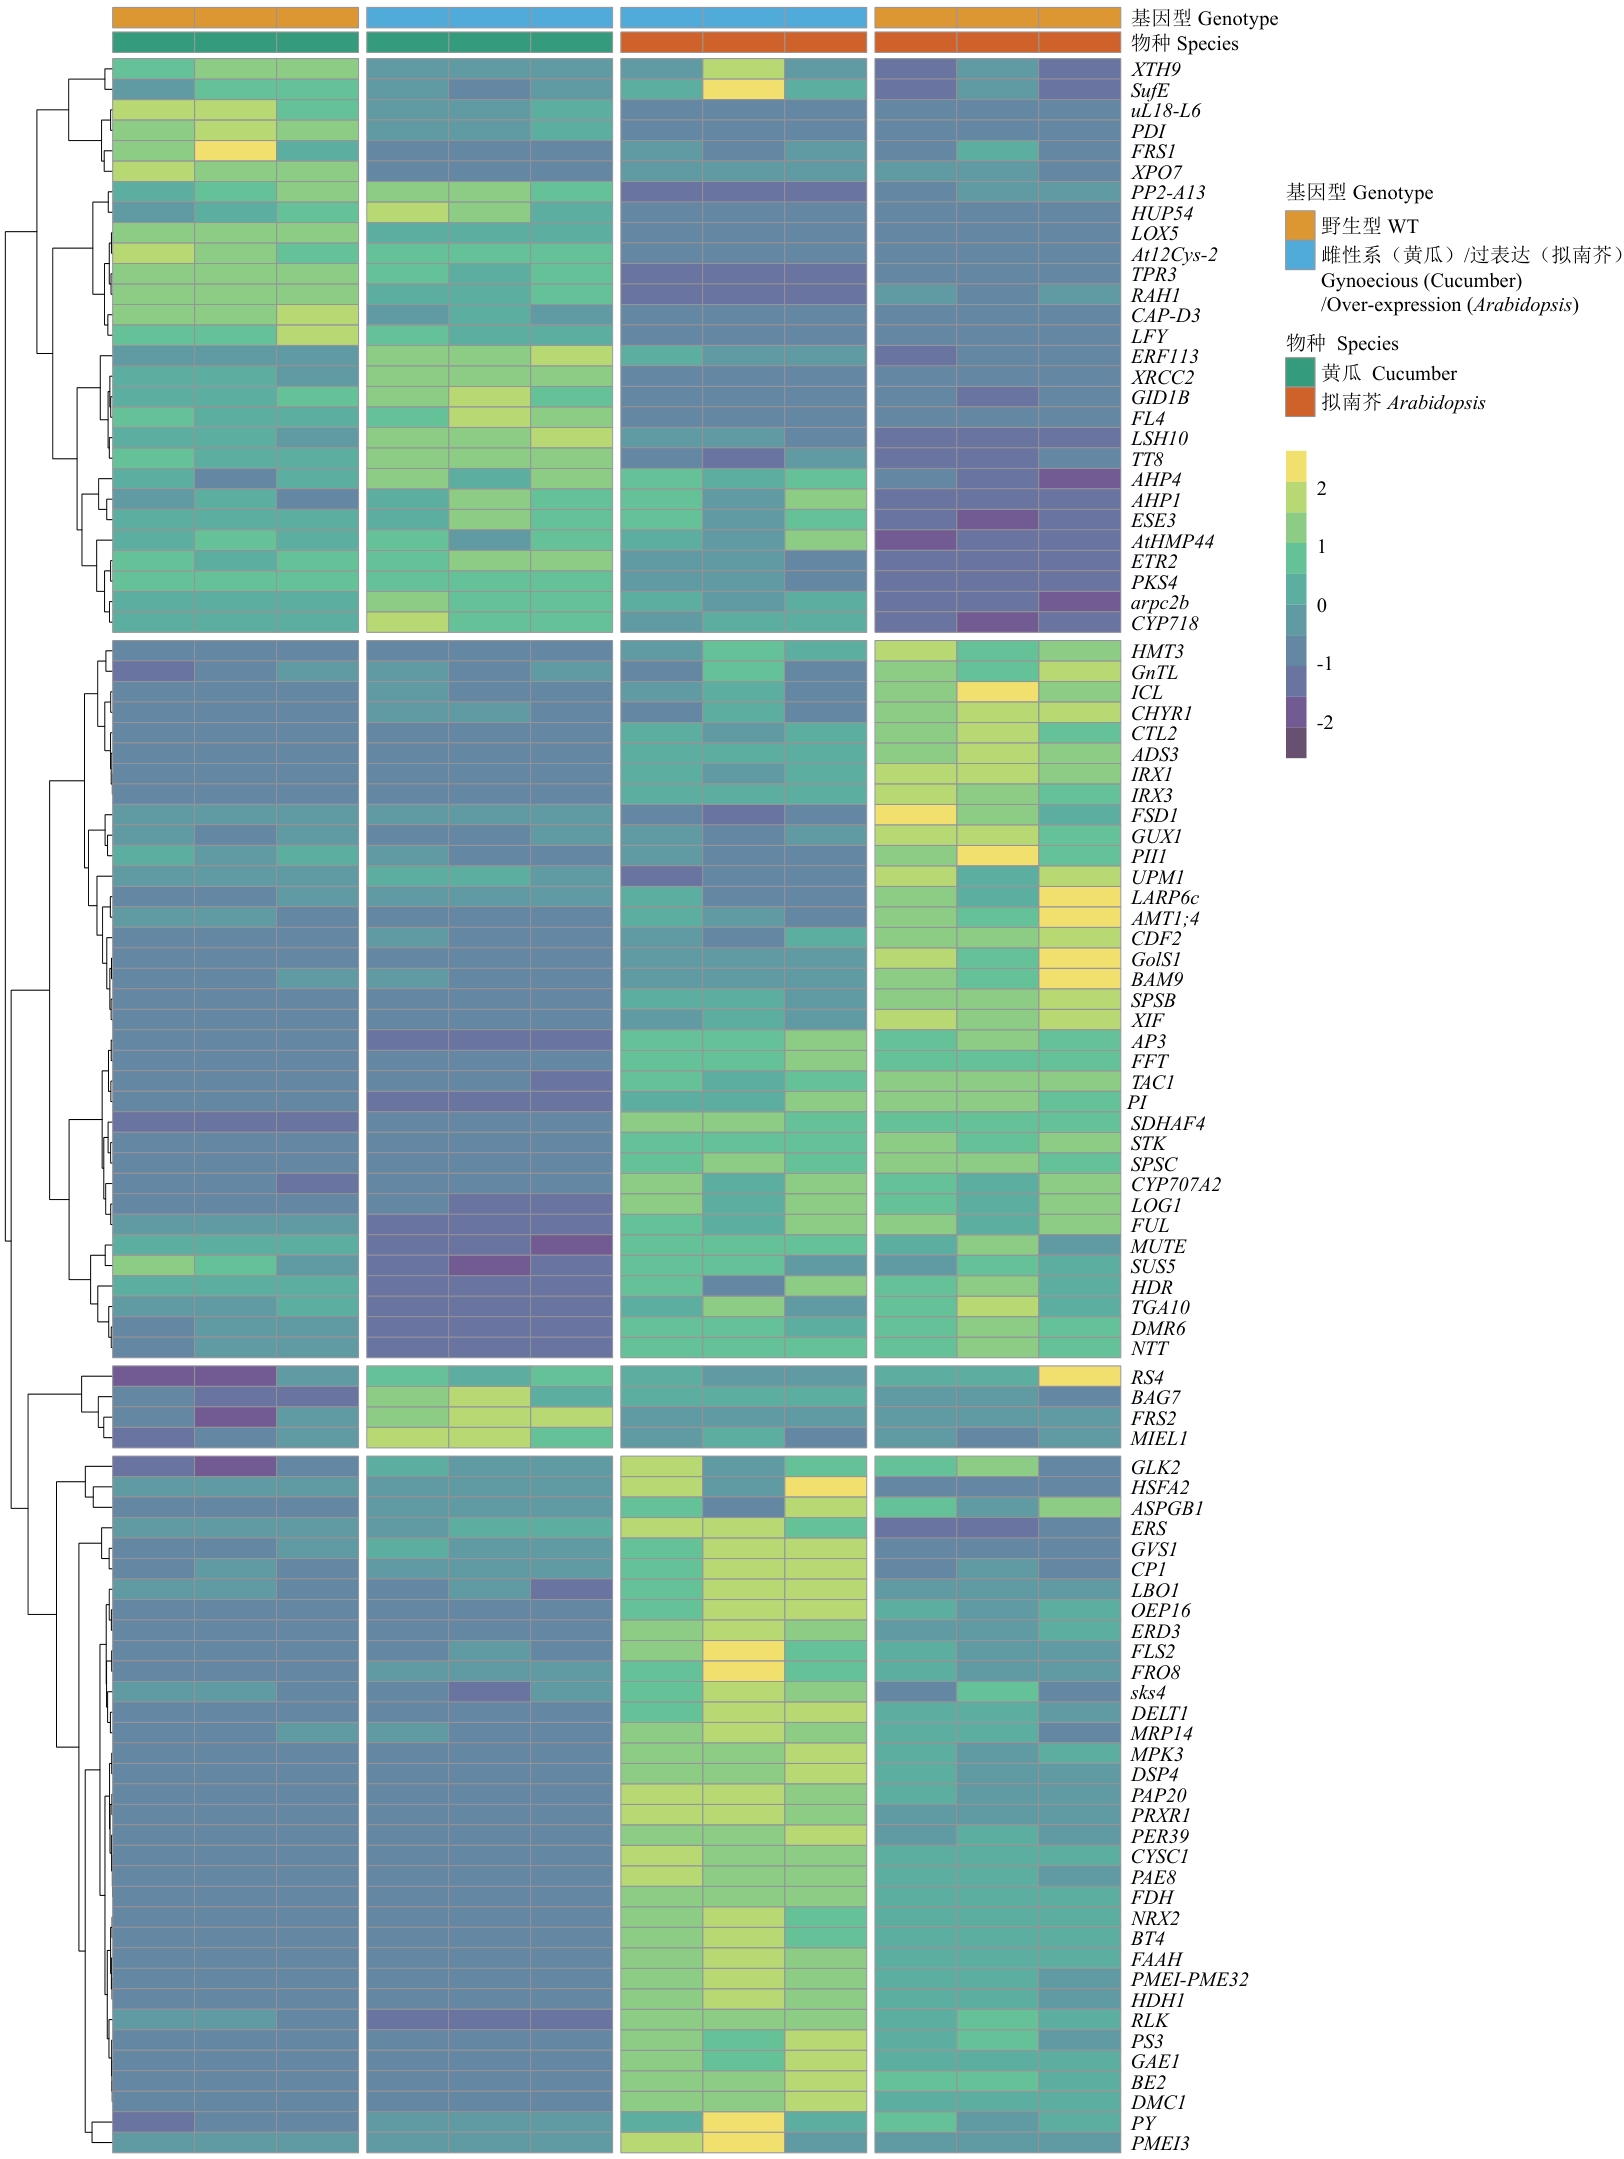
Fig. 4 Expression heatmap analysis of key genes in cucumber and ArabidopsisThe heatmap displays the expression patterns of 101 differentially expressed genes with gene symbol annotations in cucumber and Arabidopsis. Each row indicates a gene, and the colors indicate changes in gene expression levels: yellow indicates upregulated expression, while blue indicates downregulated expression. The genes are clustered based on their expression patterns. The annotation bar on the right shows the species origin and genotype. The FPKM values of each row (i.e., each gene) are normalized to Z-score scale
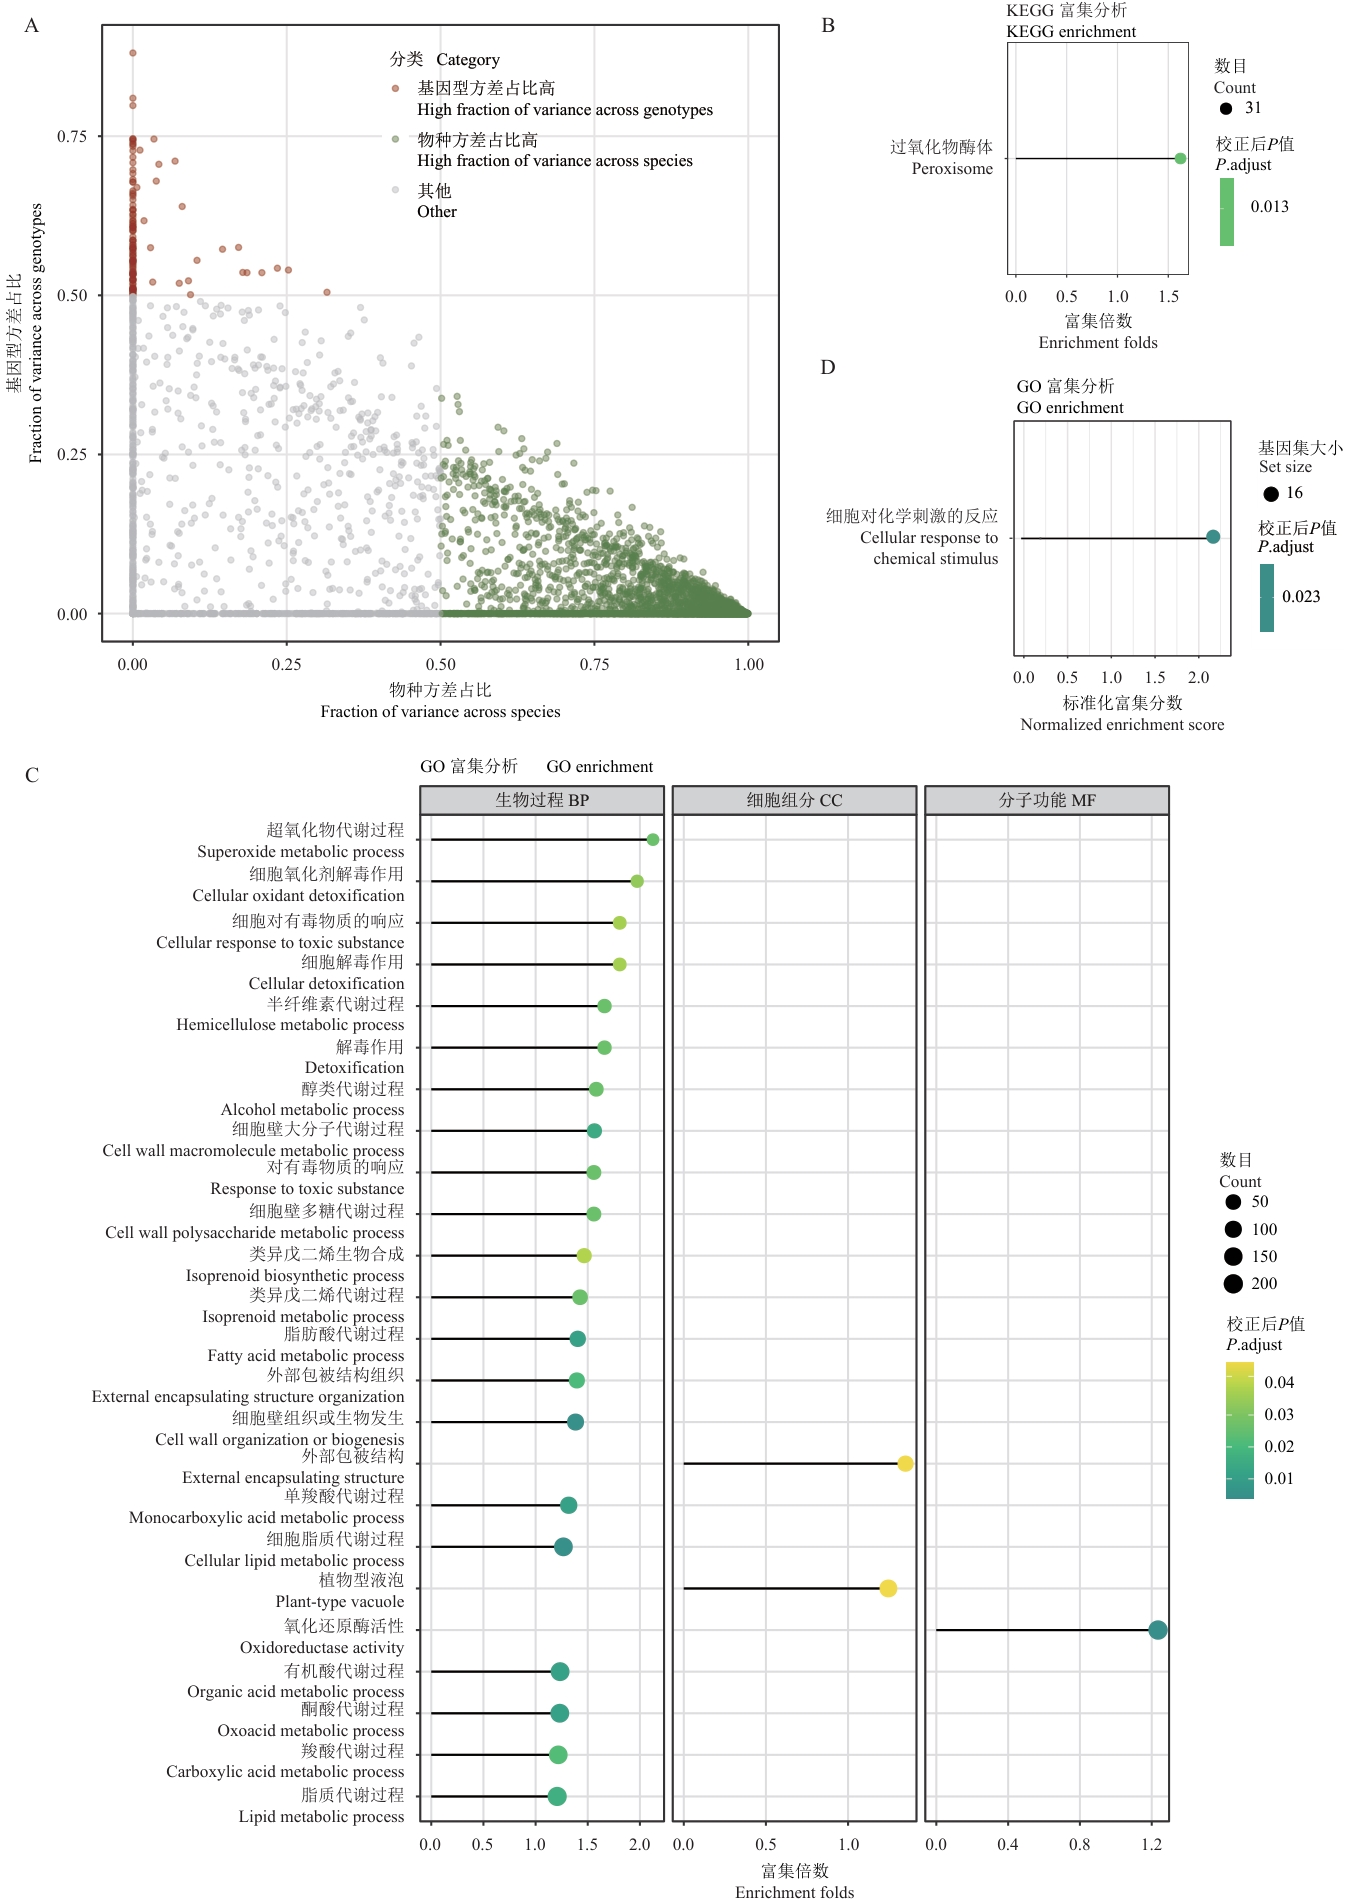
Fig. 5 Functional analysis of species- and genotype-specific genesA: Vriance distribution plot of gene expression. The X-axis indicates the fraction of variance across species, while the Y-axis indicates the fraction of variance across genotypes. The color of the points indicates different categories: high genotype variance proportion (red), high species variance proportion (green), and others (gray). B: KEGG pathway enrichment analysis results for genes regulated by genotype effects. The size of the bubbles indicates the number of genes, and the color intensity indicates the adjusted P-value. The X-axis indicates the enrichment fold change. C: GO functional enrichment analysis results for genes regulated by genotype effects. The size of the bubbles indicates the number of genes, and the color intensity indicates the adjusted P-value. The X-axis indicates the enrichment fold change. D: GSEA enrichment analysis results for genes regulated by genotype effects. The size of the bubbles indicates the number of genes set, the color indicates the adjusted P-value, and the X-axis indicates the normalized enrichment score (NES)
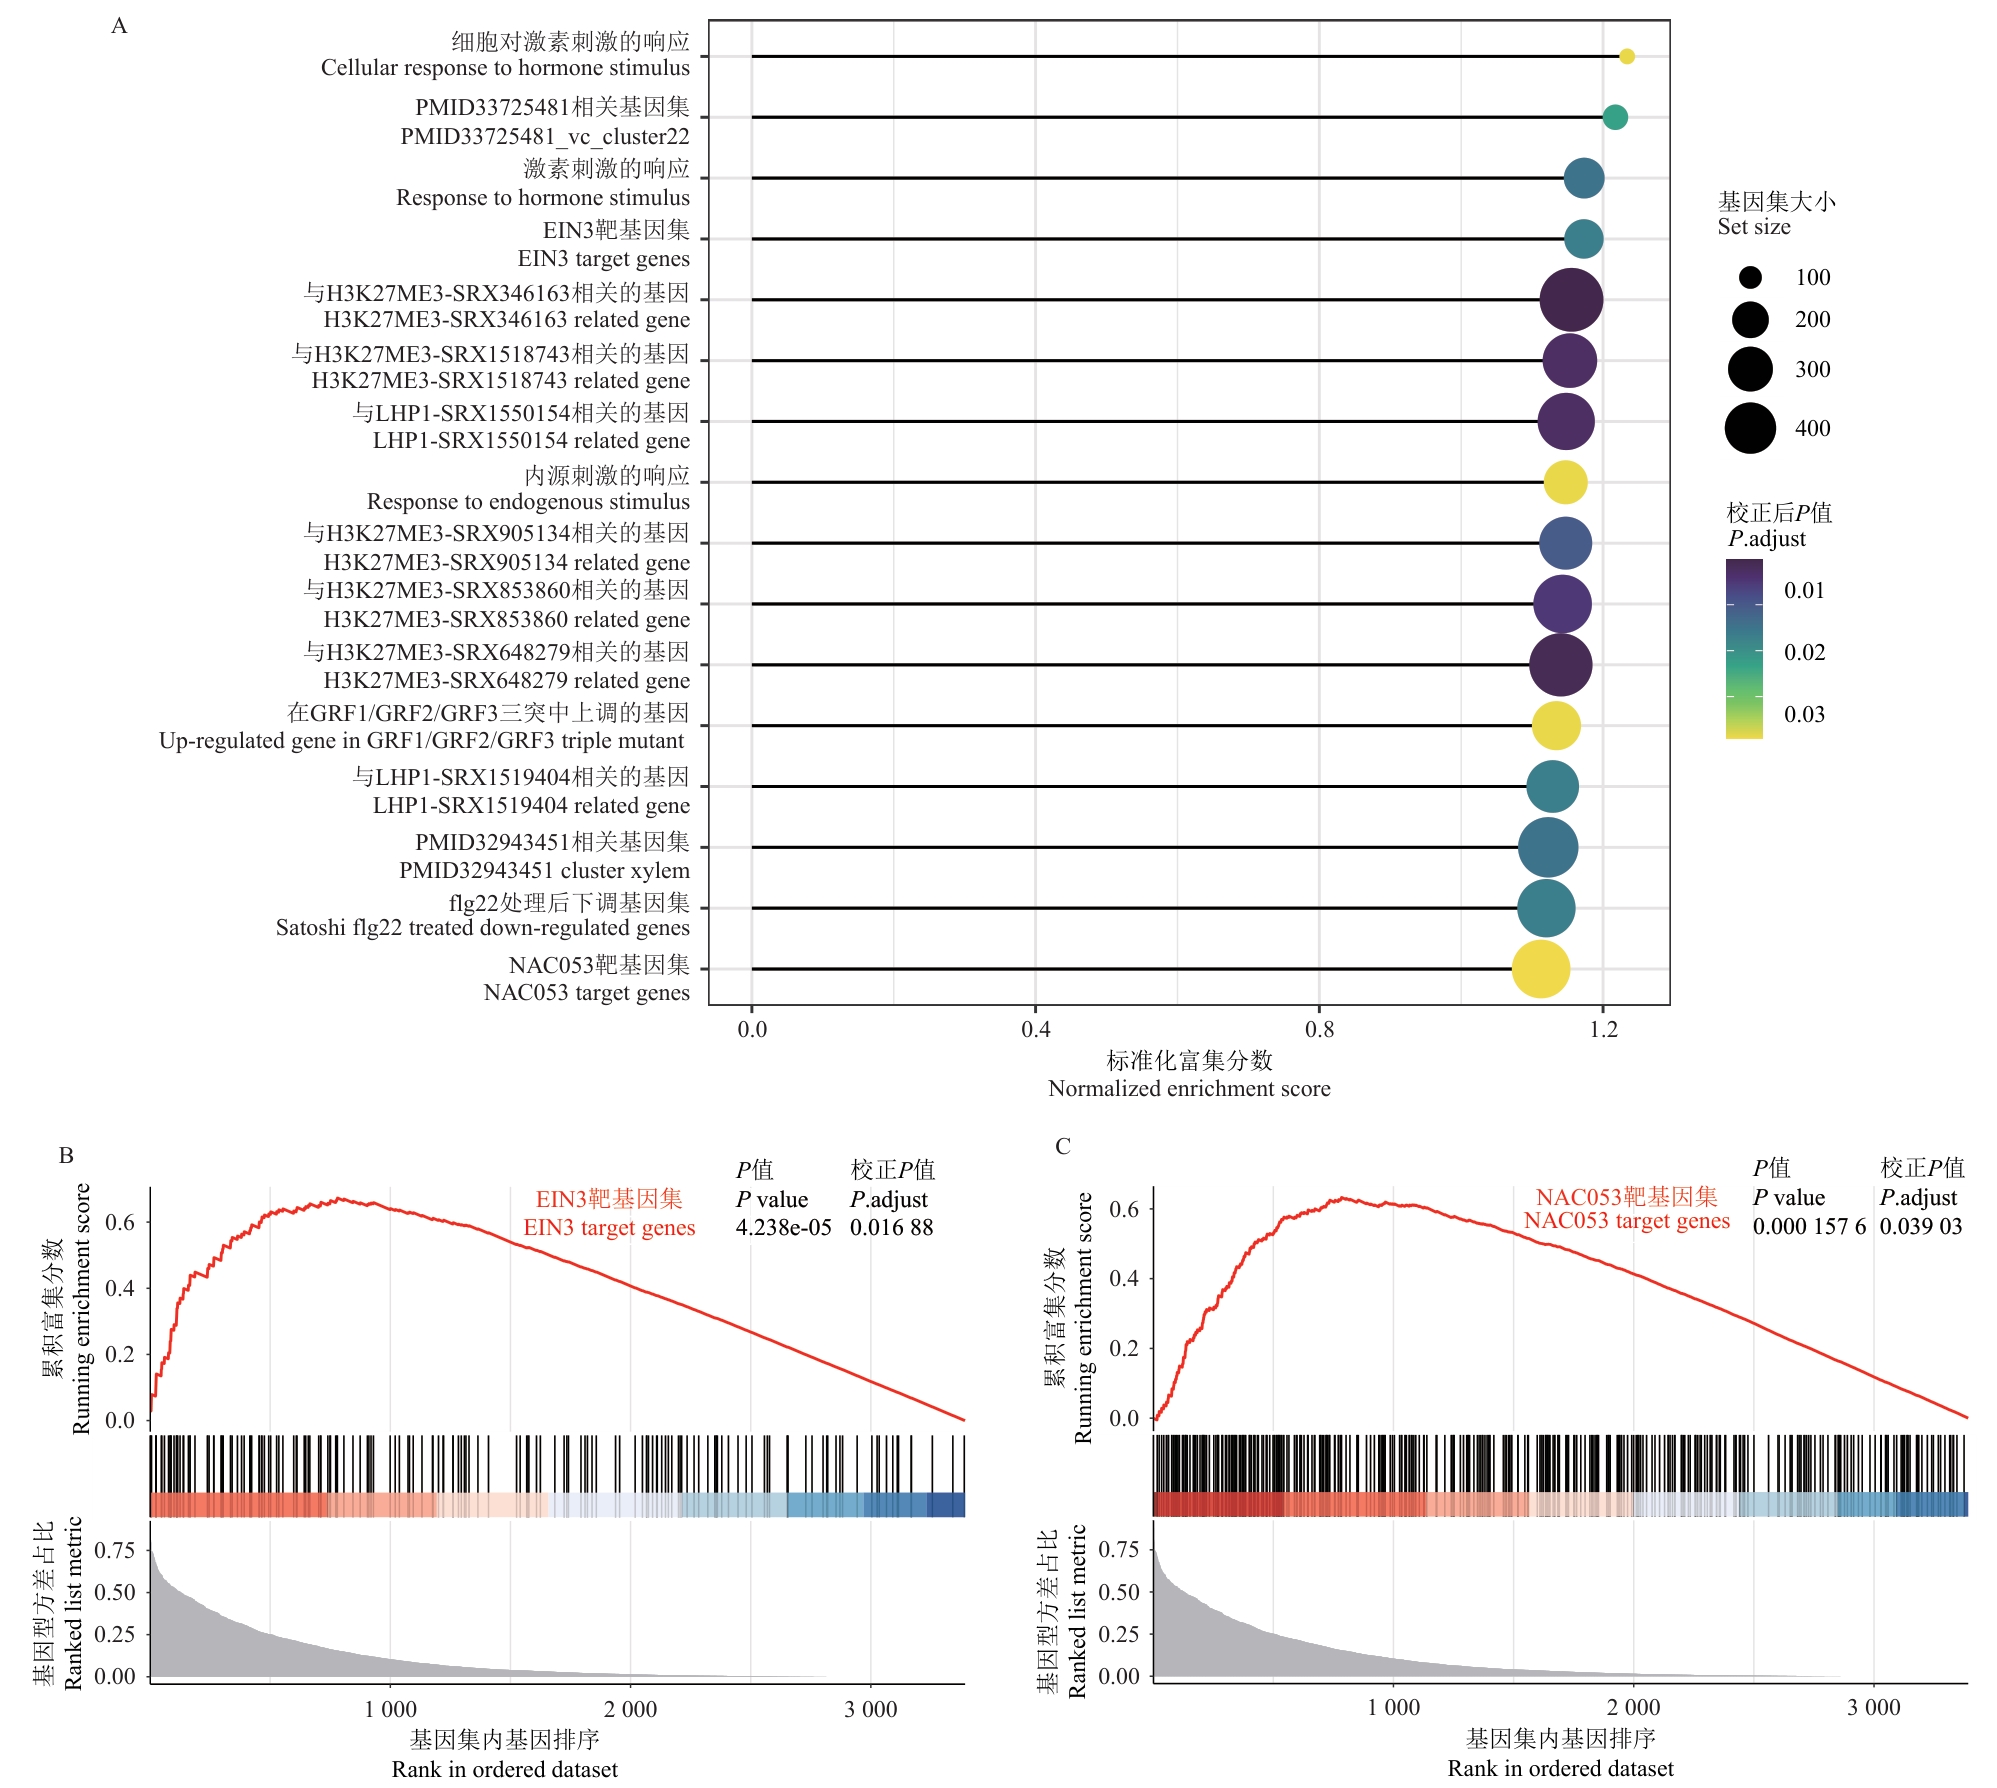
Fig. 6 Gene set enrichment analysis of PlantGSADA: Enrichment analysis results for PlantGSAD gene sets regulated by genotype effects. The lollipop chart displays significantly enriched PlantGSAD gene sets, where the size of a bubble indicates the size of the gene sets, the color intensity indicates the adjusted P-value, and the X-axis indicates the normalized enrichment score. B: Enrichment analysis results for the EIN3 target gene set. The upper panel shows the running enrichment score, while the lower panel displays the distribution of genes in the ranking of genotype variance proportions. C: Enrichment analysis results for the NAC053 target gene set. It similarly displays the running enrichment score and the gene distribution plot
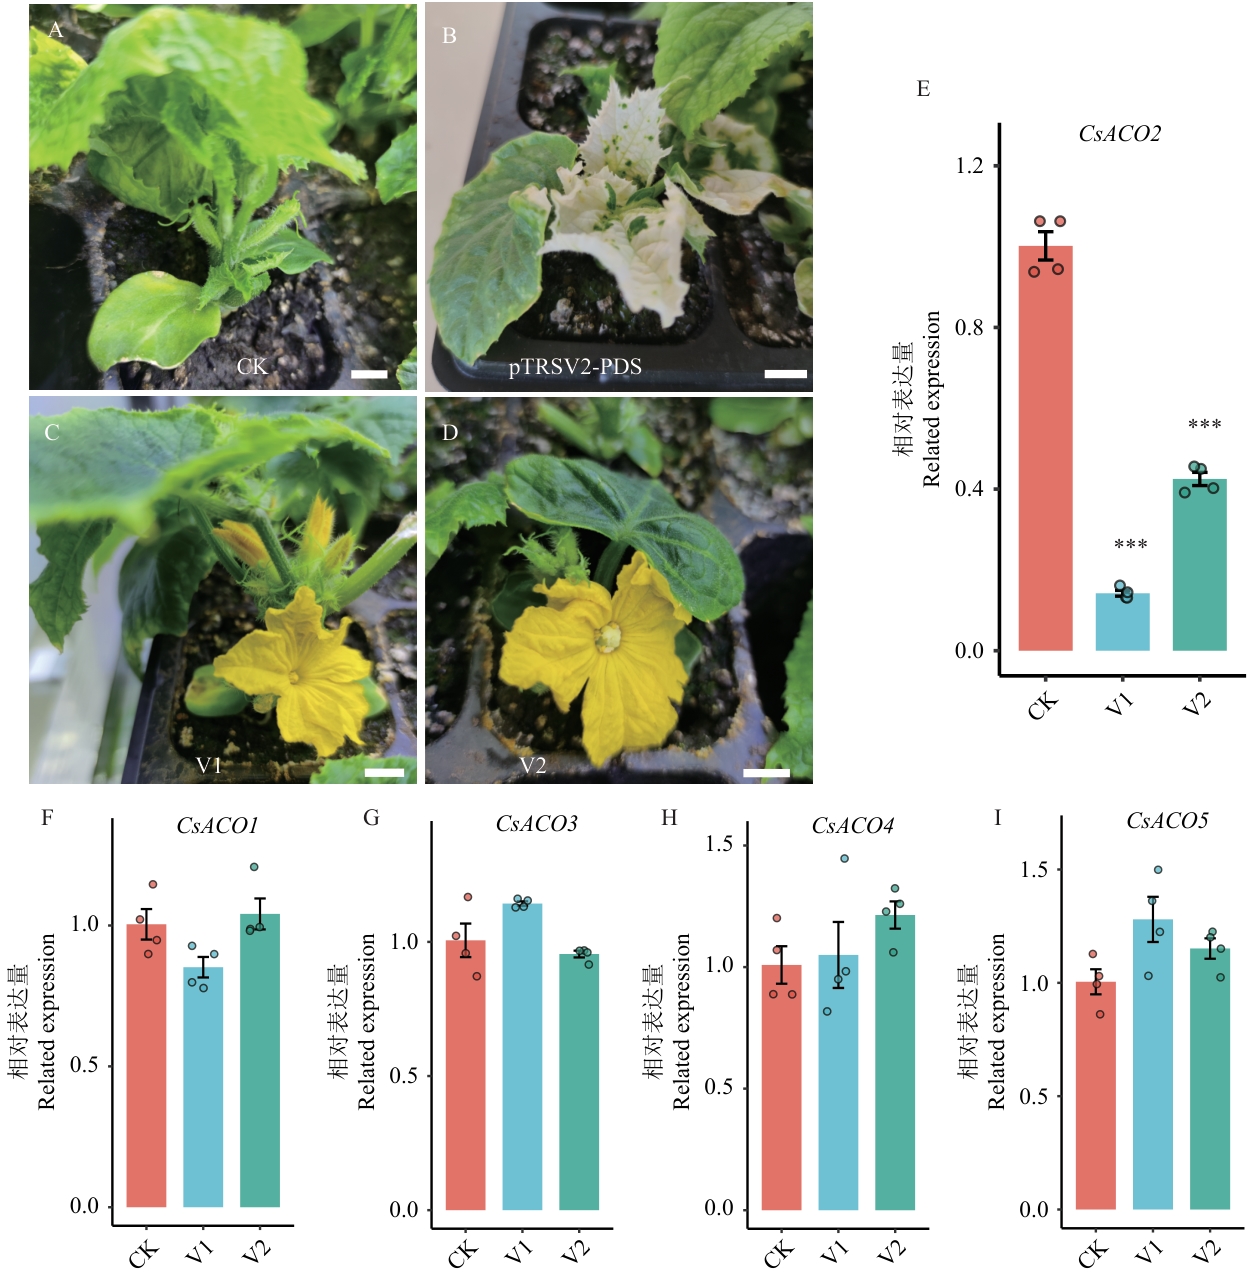
Fig. 7 VIGS analysis of the CsACO2 gene in gynoecious cucumberA: Negative control (pTRSV2-empty vector), in which the infected gynoecious cucumber (X8g) plant produces only normal female flowers. B: Positive control (pTRSV2-PDS), in which the leaves of the infected X8g plant show significant photobleaching, indicating the VIGS system is working. C: Silencing of CsACO2 (pTRSV2-CsACO2) induces the formation of male flowers on the infected X8g plant. D: Silencing of CsACO2 (pTRSV2-CsACO2) induces the formation of bisexual flowers on the infected X8g plant. Scale bar=1 cm. E‒I: RT-qPCR results showing significant downregulation of CsACO2 gene in silenced plants, while other ACO family members (CsACO1, CsACO3, CsACO4, CsACO5) showed no significant changes. CK: Empty vector control; V1, V2: two independent CsACO2-silenced plants. Bar charts show relative expression levels (mean±SD), ***P<0.001
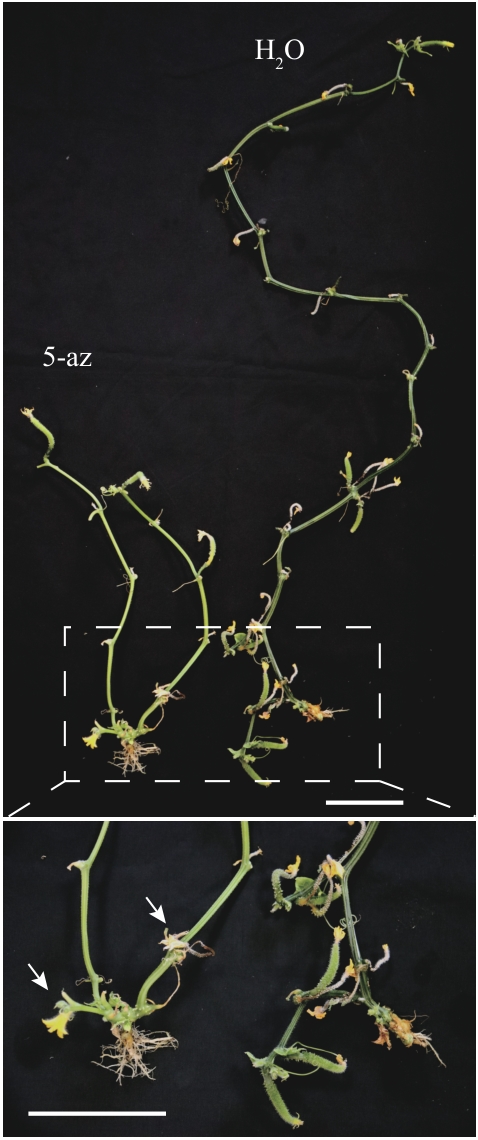
Fig. 8 Chemical treatment of gynoecious cucumber with the DNA methylation inhibitor 5-azacytidinePhenotypic difference between the 5-azacytidine treatment group (5-az) and control group (H2O). The control gynoecious X8g plant grows normally and produces female flowers, whereas the 5-az-treated plant produces male flowers. Scale bar=10 cm
| [1] | Zhang SQ, Tan FQ, Chung CH, et al. The control of carpel determinacy pathway leads to sex determination in cucurbits [J]. Science, 2022, 378(6619): 543-549. |
| [2] | Zheng JK, Xia R. Flower development and sex determination in horticultural crops [J]. Fruit Res, 2022, 2(1): 1-9. |
| [3] | Luo HY, Zhang HC, Wang HS. Advance in sex differentiation in cucumber [J]. Front Plant Sci, 2023, 14: 1186904. |
| [4] | Aparna, Skarzyńska A, Pląder W, et al. Impact of climate change on regulation of genes involved in sex determination and fruit production in cucumber [J]. Plants, 2023, 12(14): 2651. |
| [5] | Bai SN, Xu ZH. Unisexual cucumber flowers, sex and sex differentiation [J]. Int Rev Cell Mol Biol, 2013, 304: 1-55. |
| [6] | 杨森, 魏爱民, 杜胜利, 等. 黄瓜性别分化的化学调控技术研究进展 [J]. 中国瓜菜, 2009, 22(6): 31-34. |
| Yang S, Wei AM, Du SL, et al. Development of chemical regulation of cucumber sex differentiation research [J]. China Cucurbits Veg, 2009, 22(6): 31-34. | |
| [7] | Turek S, Aparna, Skarzyńska A, et al. Understanding transcription factors and how they affect processes in cucumber sex determination [J]. Metabolites, 2023, 13(6): 740. |
| [8] | Bai SL, Peng YB, Cui JX, et al. Developmental analyses reveal early arrests of the spore-bearing parts of reproductive organs in unisexual flowers of cucumber (Cucumis sativus L.) [J]. Planta, 2004, 220(2): 230-240. |
| [9] | Dong ZN, Liu XL, Guo X, et al. Developmental innovation of inferior ovaries and flower sex orchestrated by KNOX1 in cucurbits [J]. Nat Plants, 2025, 11(4): 861-877. |
| [10] | Hao YJ, Wang DH, Peng YB, et al. DNA damage in the early primordial anther is closely correlated with stamen arrest in the female flower of cucumber (Cucumis sativus L.) [J]. Planta, 2003, 217(6): 888-895. |
| [11] | Martin A, Troadec C, Boualem A, et al. A transposon-induced epigenetic change leads to sex determination in melon [J]. Nature, 2009, 461(7267): 1135-1138. |
| [12] | Hu BW, Li DW, Liu X, et al. Engineering non-transgenic gynoecious cucumber using an improved transformation protocol and optimized CRISPR/Cas9 system [J]. Mol Plant, 2017, 10(12): 1575-1578. |
| [13] | Boualem A, Troadec C, Camps C, et al. A cucurbit androecy gene reveals how unisexual flowers develop and dioecy emerges [J]. Science, 2015, 350(6261): 688-691. |
| [14] | Zhang HM, Li S, Yang L, et al. Gain-of-function of the 1-aminocyclopropane-1-carboxylate synthase gene ACS1G induces female flower development in cucumber gynoecy [J]. Plant Cell, 2021, 33(2): 306-321. |
| [15] | Knopf RR, Trebitsh T. The female-specific Cs-ACS1G gene of cucumber. A case of gene duplication and recombination between the non-sex-specific 1-aminocyclopropane-1-carboxylate synthase gene and a branched-chain amino acid transaminase gene [J]. Plant Cell Physiol, 2006, 47(9): 1217-1228. |
| [16] | Zhang ZH, Mao LY, Chen HM, et al. Genome-wide mapping of structural variations reveals a copy number variant that determines reproductive morphology in cucumber [J]. Plant Cell, 2015, 27(6): 1595-1604. |
| [17] | Li Z, Huang SW, Liu SQ, et al. Molecular isolation of the M gene suggests that a conserved-residue conversion induces the formation of bisexual flowers in cucumber plants [J]. Genetics, 2009, 182(4): 1381-1385. |
| [18] | Li Z, Wang S, Tao QY, et al. A putative positive feedback regulation mechanism in CsACS2 expression suggests a modified model for sex determination in cucumber (Cucumis sativus L.) [J]. J Exp Bot, 2012, 63(12): 4475-4484. |
| [19] | Niu HH, Wang H, Zhao BS, et al. Exogenous auxin-induced enhancer of shoot regeneration 2 (ESR2) enhances femaleness of cucumber via activating CsACS2 gene [J]. Hortic Res, 2022, 9: uhab085. |
| [20] | Tan JY, Tao QY, Niu HH, et al. A novel allele of monoecious (m) locus is responsible for elongated fruit shape and perfect flowers in cucumber (Cucumis sativus L.) [J]. Theor Appl Genet, 2015, 128(12): 2483-2493. |
| [21] | Xin TX, Zhang Z, Li S, et al. Genetic regulation of ethylene dosage for cucumber fruit elongation [J]. Plant Cell, 2019, 31(5): 1063-1076. |
| [22] | Yang ZH, Li LB, Meng ZJ, et al. Constitutive expression of cucumber CsACS2 in Arabidopsis thaliana disrupts anther dehiscence through ethylene signaling and DNA methylation pathways [J]. Plant Cell Rep, 2024, 43(12): 288. |
| [23] | Bolger AM, Lohse M, Usadel B. Trimmomatic: a flexible trimmer for Illumina sequence data [J]. Bioinformatics, 2014, 30(15): 2114-2120. |
| [24] | Kim D, Langmead B, Salzberg SL. HISAT: a fast spliced aligner with low memory requirements [J]. Nat Methods, 2015, 12(4): 357-360. |
| [25] | Li Q, Li HB, Huang W, et al. A chromosome-scale genome assembly of cucumber (Cucumis sativus L.) [J]. Gigascience, 2019, 8(6): giz072. |
| [26] | Love MI, Huber W, Anders S. Moderated estimation of fold change and dispersion for RNA-seq data with DESeq2 [J]. Genome Biol, 2014, 15(12): 550. |
| [27] | Wu TZ, Hu EQ, Xu SB, et al. clusterProfiler 4.0: a universal enrichment tool for interpreting omics data [J]. Innovation, 2021, 2(3): 100141. |
| [28] | Ma XL, Yan HY, Yang JT, et al. PlantGSAD: a comprehensive gene set annotation database for plant species [J]. Nucleic Acids Res, 2022, 50(D1): D1456-D1467. |
| [29] | Emms DM, Kelly S. OrthoFinder: phylogenetic orthology inference for comparative genomics [J]. Genome Biol, 2019, 20(1): 238. |
| [30] | Yue F, Cheng Y, Breschi A, et al. A comparative encyclopedia of DNA elements in the mouse genome [J]. Nature, 2014, 515(7527): 355-364. |
| [31] | Fang L, Wei XY, Liu LZ, et al. A tobacco ringspot virus-based vector system for gene and microRNA function studies in cucurbits [J]. Plant Physiol, 2021, 186(2): 853-864. |
| [32] | Dong MM, Xue SD, Bartholomew ES, et al. Transcriptomic and functional analysis provides molecular insights into multicellular trichome development [J]. Plant Physiol, 2022, 189(1): 301-314. |
| [33] | Chen HM, Sun JJ, Li S, et al. An ACC oxidase gene essential for cucumber carpel development [J]. Mol Plant, 2016, 9(9): 1315-1327. |
| [34] | Rashid D, Devani RS, Rodriguez-Granados NY, et al. Ethylene produced in carpel primordia controls CmHB40 expression to inhibit stamen development [J]. Nat Plants, 2023, 9(10): 1675-1687. |
| [35] | Huang HY, Zhang SQ, Abou Choucha F, et al. Harbinger transposon insertion in ethylene signaling gene leads to emergence of new sexual forms in cucurbits [J]. Nat Commun, 2024, 15(1): 4877. |
| [36] | Li CX, Dong SY, Liu XP, et al. Co-domestication of cold tolerance and female flower is determined by CsEIN2 in cucumber [J]. Plant Biotechnol J, 2025. DOI: 10.1111/pbi.70195 . |
| [37] | 牛欢欢. 黄瓜乙烯响应因子ERFs参与性别决定过程的调控研究 [D]. 杨凌: 西北农林科技大学, 2021. |
| Niu HH. Research on the regulation of cucumber ethylene-responsive factors ERFs participate in the sex determination process [D]. Yangling: Northwest A & F University, 2021. | |
| [38] | Zhou GZ, Yin HY, Chen F, et al. The genome of Areca catechu provides insights into sex determination of monoecious plants [J]. New Phytol, 2022, 236(6): 2327-2343. |
| [39] | Zhang C, Xiong AT, Ren MY, et al. An epigenetically mediated double negative cascade from EFD to HB21 regulates anther development [J]. Nat Commun, 2024, 15(1): 7796. |
| [40] | Li YL, Chen M, Khan AH, et al. Histone H3 lysine 27 trimethylation suppresses jasmonate biosynthesis and signaling to affect male fertility under high temperature in cotton [J]. Plant Commun, 2023, 4(6): 100660. |
| [1] | WANG Fang, SHAO Hui-ru, LYU Lin-long, ZHAO Dian, HU Zhen, LYU Jian-zhen, JIANG Liang. Establishment of TurboID Proximity Labeling Technology in Plants and Bacteria [J]. Biotechnology Bulletin, 2025, 41(9): 44-53. |
| [2] | LAI Shi-yu, LIANG Qiao-lan, WEI Lie-xin, NIU Er-bo, CHEN Ying-e, ZHOU Xin, YANG Si-zheng, WANG Bo. The Role of NbJAZ3 in the Infection of Nicotiana benthamiana by Alfalfa Mosaic Virus [J]. Biotechnology Bulletin, 2025, 41(8): 186-196. |
| [3] | LI Ya-qiong, GESANG La-mao, CHEN Qi-di, YANG Yu-huan, HE Hua-zhuan, ZHAO Yao-fei. Heterologous Overexpression of Sorghum SbSnRK2.1 Enhances the Resistance to Salt Stress in Arabidopsis [J]. Biotechnology Bulletin, 2025, 41(8): 115-123. |
| [4] | LIU Tong-tong, LI Xiao-hui, YANG Jun-long, CHEN Wang, YU Meng, WANG Chao-fan, WANG Feng-ru, KE Shao-ying. Functional Study on ZmSTART1 Regulation of Maize Vascular Bundle Formation [J]. Biotechnology Bulletin, 2025, 41(4): 115-122. |
| [5] | YANG Tao, LI Lin, MO Xiao-lian, CHEN Xiao-long, WANG Jian, HUANG Yuan, ZHAO Jie-hong, ZOU Jie. Functional Study of DoDELLA2 in Dendrobium officinale Kimura et Migo [J]. Biotechnology Bulletin, 2025, 41(12): 240-253. |
| [6] | HU Yong-bo, LEI Yu-tian, YANG Yong-sen, CHEN Xin, LIN Huang-fang, LIN Bi-ying, LIU Shuang, BI Ge, SHEN Bao-ying. Genome-wide Identification and Expression Pattern Analysis of the Bcl-2-related Anti-apoptotic Family in Cucumis sativus L. and Cucurbita moschata Duch. [J]. Biotechnology Bulletin, 2024, 40(6): 219-237. |
| [7] | ZHANG Yi-heng, LIU Jia-zheng, WANG Xue-chen, SUN Zheng-zhe, XUE Ya-jun, WANG Pei, HAN Hua, ZHENG Hong-wei, LI Xiao-juan. Dynamic Changes of Arabidopsis Endoplasmic Reticulum Based on Enhanced Super-resolution Images [J]. Biotechnology Bulletin, 2024, 40(4): 67-76. |
| [8] | WANG Feng-ting, ZHAO Fu-shun, QIAO Kai-bin, XU Xun, LIU Jin-liang. Progress on the Molecular Mechanism of Scion-rootstock Interactions in Vegetable Grafting [J]. Biotechnology Bulletin, 2024, 40(10): 149-159. |
| [9] | ZHANG Dao-lei, GAN Yu-jun, LE Liang, PU Li. Epigenetic Regulation of Yield-related Traits in Maize and Epibreeding [J]. Biotechnology Bulletin, 2023, 39(8): 31-42. |
| [10] | LI Yu, LI Su-zhen, CHEN Ru-mei, LU Hai-qiang. Advances in the Regulation of Iron Homeostasis by bHLH Transcription Factors in Plant [J]. Biotechnology Bulletin, 2023, 39(7): 26-36. |
| [11] | LI Zhi-qi, YUAN Yue, MIAO Rong-qing, PANG Qiu-ying, ZHANG Ai-qin. Melatonin Contents in Eutrema salsugineum and Arabidopsis thaliana Under Salt Stress, and Expression Pattern Analysis of Synthesis Related Genes [J]. Biotechnology Bulletin, 2023, 39(5): 142-151. |
| [12] | LIN Rong, ZHENG Yue-ping, XU Xue-zhen, LI Dan-dan, ZHENG Zhi-fu. Functional Analysis of ACOL8 Gene in the Ethylene Synthesis and Response in Arabidopsis thaliana [J]. Biotechnology Bulletin, 2023, 39(1): 157-165. |
| [13] | YANG Hua-jie, ZHOU Yu-ping, FAN Tian, LV Tian-xiao, XIE Chu-ping, TIAN Chang-en. Screening and Identification of IQM4-Interacting Proteins in Arabidopsis thaliana [J]. Biotechnology Bulletin, 2021, 37(11): 190-196. |
| [14] | FANG Dan-dan, ZHANG Ting, WEN Xiao-peng. Overexpression of Pinus massoniana PmPT3 Gene in Arabidopsis thaliana Increasing Low Phosphorus Tolerance [J]. Biotechnology Bulletin, 2021, 37(10): 1-8. |
| [15] | WU Xiao, ZHUANG Zhan-wei, MA Xiao-li, HUANG Si-xiu, LI Zi-cong, XU Zheng. Research Progress on the Nuclear Reprogramming After Somatic Cells Nuclear Transfer in Mammalian [J]. Biotechnology Bulletin, 2019, 35(11): 187-194. |
| Viewed | ||||||
|
Full text |
|
|||||
|
Abstract |
|
|||||