


Biotechnology Bulletin ›› 2025, Vol. 41 ›› Issue (7): 81-94.doi: 10.13560/j.cnki.biotech.bull.1985.2025-0031
Previous Articles Next Articles
DUAN Min-jie( ), LI Yi-fei, WANG Chun-ping, HUANG Ren-zhong, HUANG Qi-zhong, ZHANG Shi-cai()
Received:2025-01-08
Online:2025-07-26
Published:2025-07-22
Contact:
ZHANG Shi-cai
E-mail:swemart@163.com;shicaiz@126.com
DUAN Min-jie, LI Yi-fei, WANG Chun-ping, HUANG Ren-zhong, HUANG Qi-zhong, ZHANG Shi-cai. Association Analysis and Fingerprint Map Construction of Fruit Color Traits in Pepper via SSR Markers[J]. Biotechnology Bulletin, 2025, 41(7): 81-94.
序号 No. | 原始编号 Original number | 果型 Fruit type | 红椒颜色 Colour | 色价 E | 序号 No. | 原始编号 Original number | 果型 Fruit type | 红椒颜色 Colour | 色价 E |
|---|---|---|---|---|---|---|---|---|---|
| CQ01 | 1189 | 粗大牛角 | 深红 | 25.6 | CQ30 | 2529 | 羊角 | 深红 | 8.9 |
| CQ02 | 2718 | 长牛角 | 深红 | 27.1 | CQ31 | 2507 | 细长牛角 | 大红 | 14.2 |
| CQ03 | 2688 | 灯笼 | 浅红 | 6.5 | CQ32 | 9704 | 牛角 | 浅红 | 5.1 |
| CQ04 | 1075 | 长牛角 | 浅红 | 3.0 | CQ33 | 2641 | 灯笼 | 深红 | 12.4 |
| CQ05 | 13032 | 细长牛角 | 大红 | 6.3 | CQ34 | 1915 | 牛角 | 深红 | 29.4 |
| CQ06 | 1408 | 长牛角 | 大红 | 9.6 | CQ35 | 1916 | 羊角 | 深红 | 27.7 |
| CQ07 | 1438 | 羊角 | 酱红 | 8.8 | CQ36 | 1917 | 牛角 | 深红 | 20.1 |
| CQ08 | 1389 | 羊角 | 大红 | 8.0 | CQ37 | 2771 | 羊角 | 酱红 | 17.7 |
| CQ09 | 1195 | 细牛角 | 大红 | 9.7 | CQ38 | 1474 | 牛角 | 大红 | 5.4 |
| CQ10 | 1193 | 羊角 | 大红 | 8.3 | CQ39 | 1436 | 羊角 | 大红 | 13.2 |
| CQ11 | 1124 | 灯笼 | 深红 | 16.8 | CQ40 | 1572 | 羊角 | 深红 | 24.4 |
| CQ12 | 1591 | 粗大牛角 | 深红 | 12.2 | CQ41 | 2640 | 牛角 | 深红 | 17.2 |
| CQ13 | 1592 | 螺丝椒 | 深红 | 14.5 | CQ42 | 1620 | 羊角 | 深红 | 17.6 |
| CQ14 | 1298 | 细长牛角 | 大红 | 10.1 | CQ43 | 1131 | 大羊角 | 大红 | 5.9 |
| CQ15 | 1125 | 牛角 | 大红 | 10.2 | CQ44 | 2759 | 牛角 | 大红 | 9.3 |
| CQ16 | 1118 | 细长牛角 | 大红 | 9.1 | CQ45 | 1199 | 羊角 | 酱红 | 14.6 |
| CQ17 | 1183 | 螺丝椒 | 大红 | 7.8 | CQ46 | 0416L08 | 牛角 | 大红 | 12.0 |
| CQ18 | 1632 | 灯笼 | 深红 | 7.1 | CQ47 | 1724 | 细长牛角 | 大红 | 14.2 |
| CQ19 | 0416L16 | 细长牛角 | 大红 | 9.1 | CQ48 | 1630 | 细长牛角 | 大红 | 9.4 |
| CQ20 | 1631 | 大羊角 | 浅红 | 4.3 | CQ49 | 2680 | 羊角 | 酱红 | 21.3 |
| CQ21 | 2730 | 牛角 | 浅红 | 4.0 | CQ50 | 1194 | 牛角 | 深红 | 11.1 |
| CQ22 | 2659 | 螺丝椒 | 深红 | 18.6 | CQ51 | 1192 | 羊角 | 大红 | 8.3 |
| CQ23 | 2733 | 牛角 | 浅红 | 4.5 | CQ52 | 83-3 | 牛角 | 浅红 | 5.1 |
| CQ24 | 2651 | 螺丝椒 | 大红 | 9.0 | CQ53 | 2719 | 灯笼 | 大红 | 11.8 |
| CQ25 | 1625 | 螺丝椒 | 深红 | 12.1 | CQ54 | 2762 | 螺丝椒 | 大红 | 12.4 |
| CQ26 | 1508 | 长牛角 | 酱红 | 8.7 | CQ55 | 2765 | 螺丝椒 | 大红 | 11.3 |
| CQ27 | 1488 | 粗大牛角 | 大红 | 7.2 | CQ56 | 13023 | 细长牛角 | 大红 | 8.0 |
| CQ28 | 1190 | 细长牛角 | 大红 | 11.3 | CQ57 | 1068 | 细长牛角 | 深红 | 14.4 |
| CQ29 | 1191 | 牛角 | 深红 | 12.5 |
Table 1 Information of tested materials
序号 No. | 原始编号 Original number | 果型 Fruit type | 红椒颜色 Colour | 色价 E | 序号 No. | 原始编号 Original number | 果型 Fruit type | 红椒颜色 Colour | 色价 E |
|---|---|---|---|---|---|---|---|---|---|
| CQ01 | 1189 | 粗大牛角 | 深红 | 25.6 | CQ30 | 2529 | 羊角 | 深红 | 8.9 |
| CQ02 | 2718 | 长牛角 | 深红 | 27.1 | CQ31 | 2507 | 细长牛角 | 大红 | 14.2 |
| CQ03 | 2688 | 灯笼 | 浅红 | 6.5 | CQ32 | 9704 | 牛角 | 浅红 | 5.1 |
| CQ04 | 1075 | 长牛角 | 浅红 | 3.0 | CQ33 | 2641 | 灯笼 | 深红 | 12.4 |
| CQ05 | 13032 | 细长牛角 | 大红 | 6.3 | CQ34 | 1915 | 牛角 | 深红 | 29.4 |
| CQ06 | 1408 | 长牛角 | 大红 | 9.6 | CQ35 | 1916 | 羊角 | 深红 | 27.7 |
| CQ07 | 1438 | 羊角 | 酱红 | 8.8 | CQ36 | 1917 | 牛角 | 深红 | 20.1 |
| CQ08 | 1389 | 羊角 | 大红 | 8.0 | CQ37 | 2771 | 羊角 | 酱红 | 17.7 |
| CQ09 | 1195 | 细牛角 | 大红 | 9.7 | CQ38 | 1474 | 牛角 | 大红 | 5.4 |
| CQ10 | 1193 | 羊角 | 大红 | 8.3 | CQ39 | 1436 | 羊角 | 大红 | 13.2 |
| CQ11 | 1124 | 灯笼 | 深红 | 16.8 | CQ40 | 1572 | 羊角 | 深红 | 24.4 |
| CQ12 | 1591 | 粗大牛角 | 深红 | 12.2 | CQ41 | 2640 | 牛角 | 深红 | 17.2 |
| CQ13 | 1592 | 螺丝椒 | 深红 | 14.5 | CQ42 | 1620 | 羊角 | 深红 | 17.6 |
| CQ14 | 1298 | 细长牛角 | 大红 | 10.1 | CQ43 | 1131 | 大羊角 | 大红 | 5.9 |
| CQ15 | 1125 | 牛角 | 大红 | 10.2 | CQ44 | 2759 | 牛角 | 大红 | 9.3 |
| CQ16 | 1118 | 细长牛角 | 大红 | 9.1 | CQ45 | 1199 | 羊角 | 酱红 | 14.6 |
| CQ17 | 1183 | 螺丝椒 | 大红 | 7.8 | CQ46 | 0416L08 | 牛角 | 大红 | 12.0 |
| CQ18 | 1632 | 灯笼 | 深红 | 7.1 | CQ47 | 1724 | 细长牛角 | 大红 | 14.2 |
| CQ19 | 0416L16 | 细长牛角 | 大红 | 9.1 | CQ48 | 1630 | 细长牛角 | 大红 | 9.4 |
| CQ20 | 1631 | 大羊角 | 浅红 | 4.3 | CQ49 | 2680 | 羊角 | 酱红 | 21.3 |
| CQ21 | 2730 | 牛角 | 浅红 | 4.0 | CQ50 | 1194 | 牛角 | 深红 | 11.1 |
| CQ22 | 2659 | 螺丝椒 | 深红 | 18.6 | CQ51 | 1192 | 羊角 | 大红 | 8.3 |
| CQ23 | 2733 | 牛角 | 浅红 | 4.5 | CQ52 | 83-3 | 牛角 | 浅红 | 5.1 |
| CQ24 | 2651 | 螺丝椒 | 大红 | 9.0 | CQ53 | 2719 | 灯笼 | 大红 | 11.8 |
| CQ25 | 1625 | 螺丝椒 | 深红 | 12.1 | CQ54 | 2762 | 螺丝椒 | 大红 | 12.4 |
| CQ26 | 1508 | 长牛角 | 酱红 | 8.7 | CQ55 | 2765 | 螺丝椒 | 大红 | 11.3 |
| CQ27 | 1488 | 粗大牛角 | 大红 | 7.2 | CQ56 | 13023 | 细长牛角 | 大红 | 8.0 |
| CQ28 | 1190 | 细长牛角 | 大红 | 11.3 | CQ57 | 1068 | 细长牛角 | 深红 | 14.4 |
| CQ29 | 1191 | 牛角 | 深红 | 12.5 |
| 序号Code | 引物 Primer | 上游引物 Forward primer (5'-3') | 下游引物 Reverse primer (5'-3') |
|---|---|---|---|
| SSR1 | ge241-820pms0561W | GGGAAATCATCAGTAATACTGAGAG | GGTGGAAACTTGCTTGGAGATTG |
| SSR2 | ge114-658pmr0232C | CGGTATTAAAATTTACTACGAATAAGC | GACAGATTTGTTAAAATATAGTGTGAC |
| SSR3 | CAMS-336 | GGTGGAAACTTGCTTGGAGA | CCCAGAACCATCCACCTACT |
| SSR4 | Hpms 1-214 | TGCGAGTACCGAGTTCTTTCTAG | GGCAGTCCTGGGACAACTCG |
| SSR5 | ES297 | TCAGCGATTAAGAATGCGATTG | CCAAATTGCCCTCTCTCTTCCT |
| SSR6 | CAMS-117 | TTGTGGAGGAAACAAGCAAA | CCTCAGCCCAGGAGACATAA |
| SSR7 | ge69-375pmH0312C | ACCCAAAAATTGTCATCTGTCCTC | GTTTCAATACCTGGAAAGGATCGTCAGC |
| SSR8 | HpmsE072 | GCTCATCAACCCACCTTCATCA | ATGCGTTGTCCGAGTAGGGAAG |
| SSR9 | CAMS-309 | GAAAATCGACCCGTTTTGAA | TCAATTCGGACAAAATTAGCAA |
| SSR10 | HPmSE002 | GCACGGCTCTATATCTCTCTATCTT | GGAACGAAATCGATCAACATCT |
| SSR11 | HPmSE004 | TGGGAAGAGAAATTGTGAAAGCA | CAATGCCAACAATGGCATCCTA |
| SSR12 | CAMS-142 | GAGCGCTTAAGTGGTCATAGG | CTACAACGCCCCAAAACAAT |
| SSR13 | EPMS376 | ACCCACCTTCATCAACAACC | ATTTGTGGCTTTTCGAAACG |
| SSR14 | ES330 | GTAGCCATGGCAGAATTGGAAG | TTCAGCAGGTTCTGGTTCTGGT |
| SSR15 | ES120 | GCGGCCTTTTGATTCATACAAT | CGTTTTACTGCCCTATCTGCTTG |
| SSR16 | ES395 | TGTAATTAATTGAGGTGCGCGA | TCTCTGGTTGACAATTAGGCCC |
| SSR17 | ES321 | ACGAGGTCCACTTCCCCATTAT | TTAGAGAAGGAATAACCGGCAGC |
| SSR18 | ge12-30pmc0037C | ATCGCTGTTGTTTTCTCACCAAGT | GTTTGGGCACTTCCTTGTGTAGGTCAGT |
| SSR19 | CAMS-089 | AACAGCGCTGATCCTTTACC | CAACATCACAGTGGCAGAAGA |
| SSR20 | Hpms 1-43 | AACCAGCAATCCCATGAAAACC | GGGCTTTGGGGAGAATAGTGTG |
Table 2 Primer information
| 序号Code | 引物 Primer | 上游引物 Forward primer (5'-3') | 下游引物 Reverse primer (5'-3') |
|---|---|---|---|
| SSR1 | ge241-820pms0561W | GGGAAATCATCAGTAATACTGAGAG | GGTGGAAACTTGCTTGGAGATTG |
| SSR2 | ge114-658pmr0232C | CGGTATTAAAATTTACTACGAATAAGC | GACAGATTTGTTAAAATATAGTGTGAC |
| SSR3 | CAMS-336 | GGTGGAAACTTGCTTGGAGA | CCCAGAACCATCCACCTACT |
| SSR4 | Hpms 1-214 | TGCGAGTACCGAGTTCTTTCTAG | GGCAGTCCTGGGACAACTCG |
| SSR5 | ES297 | TCAGCGATTAAGAATGCGATTG | CCAAATTGCCCTCTCTCTTCCT |
| SSR6 | CAMS-117 | TTGTGGAGGAAACAAGCAAA | CCTCAGCCCAGGAGACATAA |
| SSR7 | ge69-375pmH0312C | ACCCAAAAATTGTCATCTGTCCTC | GTTTCAATACCTGGAAAGGATCGTCAGC |
| SSR8 | HpmsE072 | GCTCATCAACCCACCTTCATCA | ATGCGTTGTCCGAGTAGGGAAG |
| SSR9 | CAMS-309 | GAAAATCGACCCGTTTTGAA | TCAATTCGGACAAAATTAGCAA |
| SSR10 | HPmSE002 | GCACGGCTCTATATCTCTCTATCTT | GGAACGAAATCGATCAACATCT |
| SSR11 | HPmSE004 | TGGGAAGAGAAATTGTGAAAGCA | CAATGCCAACAATGGCATCCTA |
| SSR12 | CAMS-142 | GAGCGCTTAAGTGGTCATAGG | CTACAACGCCCCAAAACAAT |
| SSR13 | EPMS376 | ACCCACCTTCATCAACAACC | ATTTGTGGCTTTTCGAAACG |
| SSR14 | ES330 | GTAGCCATGGCAGAATTGGAAG | TTCAGCAGGTTCTGGTTCTGGT |
| SSR15 | ES120 | GCGGCCTTTTGATTCATACAAT | CGTTTTACTGCCCTATCTGCTTG |
| SSR16 | ES395 | TGTAATTAATTGAGGTGCGCGA | TCTCTGGTTGACAATTAGGCCC |
| SSR17 | ES321 | ACGAGGTCCACTTCCCCATTAT | TTAGAGAAGGAATAACCGGCAGC |
| SSR18 | ge12-30pmc0037C | ATCGCTGTTGTTTTCTCACCAAGT | GTTTGGGCACTTCCTTGTGTAGGTCAGT |
| SSR19 | CAMS-089 | AACAGCGCTGATCCTTTACC | CAACATCACAGTGGCAGAAGA |
| SSR20 | Hpms 1-43 | AACCAGCAATCCCATGAAAACC | GGGCTTTGGGGAGAATAGTGTG |
| 性状 Trait | Lab | 最小值 Min | 最大值 Max | 平均值 Mean | 标准差 SD | 变异系数 CV(%) | 遗传多样性指数 H′ |
|---|---|---|---|---|---|---|---|
| 色价 E | 3.0 | 29.4 | 12.00 | 6.22 | 51.84 | 1.85 | |
| 果皮 Peel | L | 29.2 | 39.2 | 33.98 | 4.05 | 11.92 | 1.58 |
| a | 28.9 | 43.9 | 36.46 | 3.31 | 9.07 | 2.07 | |
| b | 10.4 | 37.3 | 18.72 | 4.35 | 23.22 | 1.82 | |
| 果肉 Pulp | L | 19.1 | 52.0 | 41.33 | 5.72 | 13.84 | 1.94 |
| a | 26.9 | 42.9 | 35.44 | 3.48 | 9.81 | 2.08 | |
| b | 16.2 | 40.9 | 26.35 | 5.57 | 21.14 | 2.07 | |
| 平均值 Mean | 19.1 | 40.8 | 29.18 | 4.67 | 20.12 | 1.92 |
Table 3 Variation of seven quantitative traits for pepper fruit color
| 性状 Trait | Lab | 最小值 Min | 最大值 Max | 平均值 Mean | 标准差 SD | 变异系数 CV(%) | 遗传多样性指数 H′ |
|---|---|---|---|---|---|---|---|
| 色价 E | 3.0 | 29.4 | 12.00 | 6.22 | 51.84 | 1.85 | |
| 果皮 Peel | L | 29.2 | 39.2 | 33.98 | 4.05 | 11.92 | 1.58 |
| a | 28.9 | 43.9 | 36.46 | 3.31 | 9.07 | 2.07 | |
| b | 10.4 | 37.3 | 18.72 | 4.35 | 23.22 | 1.82 | |
| 果肉 Pulp | L | 19.1 | 52.0 | 41.33 | 5.72 | 13.84 | 1.94 |
| a | 26.9 | 42.9 | 35.44 | 3.48 | 9.81 | 2.08 | |
| b | 16.2 | 40.9 | 26.35 | 5.57 | 21.14 | 2.07 | |
| 平均值 Mean | 19.1 | 40.8 | 29.18 | 4.67 | 20.12 | 1.92 |

Fig. 1 Correlation analysis of 7 traits related to pepper fruit color
引物名称 Primer name | 观测等位 基因数Na | 有效等位 基因数Ne | 香农信息 指数I | Nei’s遗传 多样性指数H | 多态信息含量 PIC | 身份概率 PI | 随机身份 概率PIsibs |
|---|---|---|---|---|---|---|---|
| SSR1 | 4 | 3.903 | 1.374 | 0.744 | 0.696 | 0.113 | 0.406 |
| SSR2 | 14 | 8.012 | 2.328 | 0.875 | 0.864 | 0.027 | 0.319 |
| SSR3 | 4 | 3.856 | 1.368 | 0.741 | 0.693 | 0.115 | 0.408 |
| SSR4 | 4 | 2.003 | 0.958 | 0.501 | 0.483 | 0.286 | 0.571 |
| SSR5 | 2 | 1.995 | 0.692 | 0.499 | 0.374 | 0.376 | 0.595 |
| SSR6 | 8 | 5.989 | 1.869 | 0.833 | 0.811 | 0.050 | 0.346 |
| SSR7 | 6 | 5.502 | 1.742 | 0.818 | 0.792 | 0.059 | 0.356 |
| SSR8 | 8 | 7.196 | 2.022 | 0.861 | 0.845 | 0.035 | 0.328 |
| SSR9 | 3 | 1.680 | 0.683 | 0.405 | 0.393 | 0.412 | 0.651 |
| SSR10 | 4 | 3.931 | 1.377 | 0.746 | 0.698 | 0.112 | 0.405 |
| SSR11 | 6 | 4.326 | 1.599 | 0.769 | 0.734 | 0.088 | 0.388 |
| SSR12 | 8 | 5.845 | 1.896 | 0.829 | 0.821 | 0.051 | 0.348 |
| SSR13 | 4 | 3.739 | 1.348 | 0.733 | 0.682 | 0.122 | 0.414 |
| SSR14 | 3 | 2.618 | 1.029 | 0.618 | 0.547 | 0.217 | 0.495 |
| SSR15 | 4 | 3.438 | 1.297 | 0.709 | 0.655 | 0.139 | 0.430 |
| SSR16 | 6 | 4.862 | 1.662 | 0.794 | 0.772 | 0.074 | 0.371 |
| SSR17 | 3 | 1.875 | 0.791 | 0.467 | 0.405 | 0.223 | 0.572 |
| SSR18 | 6 | 5.339 | 1.731 | 0.813 | 0.786 | 0.062 | 0.359 |
| SSR19 | 4 | 2.388 | 0.994 | 0.581 | 0.512 | 0.265 | 0.525 |
| SSR20 | 5 | 1.293 | 0.542 | 0.227 | 0.221 | 0.604 | 0.788 |
| 平均值 Mean | 5.095 | 3.847 | 1.300 | 0.646 | 0.624 | 0.171 | 0.454 |
| 组合 Combined | — | — | — | — | — | 8.314×10⁻²⁰ | 3.260×10⁻⁸ |
Table 4 Genetic diversity information of 20 SSR primers
引物名称 Primer name | 观测等位 基因数Na | 有效等位 基因数Ne | 香农信息 指数I | Nei’s遗传 多样性指数H | 多态信息含量 PIC | 身份概率 PI | 随机身份 概率PIsibs |
|---|---|---|---|---|---|---|---|
| SSR1 | 4 | 3.903 | 1.374 | 0.744 | 0.696 | 0.113 | 0.406 |
| SSR2 | 14 | 8.012 | 2.328 | 0.875 | 0.864 | 0.027 | 0.319 |
| SSR3 | 4 | 3.856 | 1.368 | 0.741 | 0.693 | 0.115 | 0.408 |
| SSR4 | 4 | 2.003 | 0.958 | 0.501 | 0.483 | 0.286 | 0.571 |
| SSR5 | 2 | 1.995 | 0.692 | 0.499 | 0.374 | 0.376 | 0.595 |
| SSR6 | 8 | 5.989 | 1.869 | 0.833 | 0.811 | 0.050 | 0.346 |
| SSR7 | 6 | 5.502 | 1.742 | 0.818 | 0.792 | 0.059 | 0.356 |
| SSR8 | 8 | 7.196 | 2.022 | 0.861 | 0.845 | 0.035 | 0.328 |
| SSR9 | 3 | 1.680 | 0.683 | 0.405 | 0.393 | 0.412 | 0.651 |
| SSR10 | 4 | 3.931 | 1.377 | 0.746 | 0.698 | 0.112 | 0.405 |
| SSR11 | 6 | 4.326 | 1.599 | 0.769 | 0.734 | 0.088 | 0.388 |
| SSR12 | 8 | 5.845 | 1.896 | 0.829 | 0.821 | 0.051 | 0.348 |
| SSR13 | 4 | 3.739 | 1.348 | 0.733 | 0.682 | 0.122 | 0.414 |
| SSR14 | 3 | 2.618 | 1.029 | 0.618 | 0.547 | 0.217 | 0.495 |
| SSR15 | 4 | 3.438 | 1.297 | 0.709 | 0.655 | 0.139 | 0.430 |
| SSR16 | 6 | 4.862 | 1.662 | 0.794 | 0.772 | 0.074 | 0.371 |
| SSR17 | 3 | 1.875 | 0.791 | 0.467 | 0.405 | 0.223 | 0.572 |
| SSR18 | 6 | 5.339 | 1.731 | 0.813 | 0.786 | 0.062 | 0.359 |
| SSR19 | 4 | 2.388 | 0.994 | 0.581 | 0.512 | 0.265 | 0.525 |
| SSR20 | 5 | 1.293 | 0.542 | 0.227 | 0.221 | 0.604 | 0.788 |
| 平均值 Mean | 5.095 | 3.847 | 1.300 | 0.646 | 0.624 | 0.171 | 0.454 |
| 组合 Combined | — | — | — | — | — | 8.314×10⁻²⁰ | 3.260×10⁻⁸ |

Fig. 2 Heat map of genetic similarity of 57 pepper germplasm materials

Fig. 3 UPGMA dengrogram of 57 pepper germplasms based on SSR markersThe red font indicates the germplasm materials included in Pop I in the population structure analysis

Fig. 4 ∆K curve of different K values

Fig. 5 Analysis of population structure of 57 pepper germplasmsRed and blue indicate the individual’s estimated membership fractions of pop Ⅰ and pop Ⅱ
性状 Trait | 标记Marker | GLM | MLM | ||
|---|---|---|---|---|---|
P值 P value | 表型解释率 Phenotypic interpretation rate (%) | P值 P value | 表型解释率 Phenotypic interpretation rate (%) | ||
| 色价 E | SSR4 | 0.009 1 | 13.8 | — | — |
| SSR13 | 0.022 1 | 8.0 | — | — | |
| SSR5 | 0.038 1 | 6.6 | — | — | |
| SSR10 | — | — | 0.046 2 | 6.89 | |
| 果皮 Peel-L | SSR18 | 0.045 0 | 8.4 | — | — |
| 果皮 Peel-a | SSR8 | 0.045 7 | 7.2 | — | — |
| SSR17 | — | — | 0.045 7 | 7.14 | |
| 果皮 Peel-b | SSR6 | 0.015 8 | 10.0 | 0.042 3 | 8.19 |
| SSR7 | 0.042 5 | 7.2 | — | — | |
| 果肉 Pulp-L | SSR8 | 0.048 2 | 7.3 | — | — |
| 果肉 Pulp-a | SSR9 | 0.019 6 | 9.4 | 0.045 4 | 6.80 |
| SSR12 | 0.044 4 | 8.5 | — | — | |
| 果肉 Pulp-b | SSR17 | 0.044 8 | 6.9 | 0.049 8 | 7.22 |
Table 5 Results of trait association analysis by SSR
性状 Trait | 标记Marker | GLM | MLM | ||
|---|---|---|---|---|---|
P值 P value | 表型解释率 Phenotypic interpretation rate (%) | P值 P value | 表型解释率 Phenotypic interpretation rate (%) | ||
| 色价 E | SSR4 | 0.009 1 | 13.8 | — | — |
| SSR13 | 0.022 1 | 8.0 | — | — | |
| SSR5 | 0.038 1 | 6.6 | — | — | |
| SSR10 | — | — | 0.046 2 | 6.89 | |
| 果皮 Peel-L | SSR18 | 0.045 0 | 8.4 | — | — |
| 果皮 Peel-a | SSR8 | 0.045 7 | 7.2 | — | — |
| SSR17 | — | — | 0.045 7 | 7.14 | |
| 果皮 Peel-b | SSR6 | 0.015 8 | 10.0 | 0.042 3 | 8.19 |
| SSR7 | 0.042 5 | 7.2 | — | — | |
| 果肉 Pulp-L | SSR8 | 0.048 2 | 7.3 | — | — |
| 果肉 Pulp-a | SSR9 | 0.019 6 | 9.4 | 0.045 4 | 6.80 |
| SSR12 | 0.044 4 | 8.5 | — | — | |
| 果肉 Pulp-b | SSR17 | 0.044 8 | 6.9 | 0.049 8 | 7.22 |
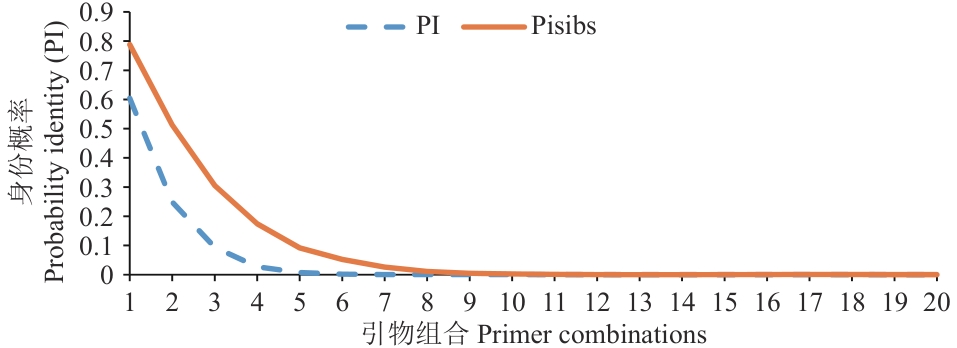
Fig. 6 Evaluation for the fingerprinting power of 20 SSR markers in pepper germplasms
| 编号Number | 指纹信息 Fingerprint information | 编号Number | 指纹信息 Fingerprint information |
|---|---|---|---|
| CQ01 | 00000100001000-01000100-10001000-00100010-100100-010010-101000-100000-1010 | CQ30 | 00010000100000-01000100-10001000-00100010-100100-000101-101000-000100-1010 |
| CQ02 | 00100001000000-01000100-01000100-00100010-001001-101000-010010-010000-1010 | CQ31 | 00100001000000-10001000-10001000-01000100-010010-101000-101000-000010-1010 |
| CQ03 | 00100001000000-10001000-01000100-01000100-010010-101000-010010-000001-1010 | CQ32 | 00100001000000-10001000-10001000-01000100-010010-000101-010010-000010-0101 |
| CQ04 | 00100001000000-00010001-01000100-01000100-010010-010010-010010-000010-0101 | CQ33 | 00100001000000-00010001-10001000-10001000-010010-000101-010010-100000-1010 |
| CQ05 | 00000000010100-01000100-10001000-00010001-100100-010010-010010-010000-0101 | CQ34 | 00010000100000-01000100-00100010-00100010-001001-101000-101000-100000-1010 |
| CQ06 | 00010000100000-01000100-00010001-00100010-001001-000101-010010-100000-1010 | CQ35 | 00010000100000-01000100-00100010-00010001-001001-101000-101000-100000-1010 |
| CQ07 | 00010000100000-00100010-10001000-00100010-100100-101000-010010-100000-0101 | CQ36 | 00010000100000-01000100-01000100-00100010-001001-101000-010010-010000-1010 |
| CQ08 | 00010000100000-00010001-10001000-00100010-100100-101000-010010-000010-0101 | CQ37 | 00000000000011-00010001-01000100-00100010-100100-000101-010010-000001-0101 |
| CQ09 | 00000100001000-00100010-00100010-00010001-100100-101000-010010-000001-0101 | CQ38 | 00000000000011-01000100-10001000-00010001-001001-101000-101000-000010-1010 |
| CQ10 | 00000000010100-10001000-00100010-00100010-100100-101000-010010-000010-1010 | CQ39 | 00000000000011-00010001-01000100-00100010-100100-101000-010010-000010-0101 |
| CQ11 | 01000010000000-10001000-00100010-00010001-010010-101000-000101-001000-1010 | CQ40 | 01000010000000-00010001-01000100-01000100-010010-101000-101000-001000-1010 |
| CQ12 | 00010000100000-00010001-00100010-00100010-010010-000101-101000-100000-1010 | CQ41 | 00100001000000-01000100-10001000-00100010-001001-101000-010010-010000-1010 |
| CQ13 | 00000100001000-00010001-00100010-00100010-010010-101000-101000-100000-0101 | CQ42 | 00010000100000-00010001-00100010-10001000-100100-010010-101000-100000-0101 |
| CQ14 | 00010000100000-10001000-10001000-01000100-010010-101000-010010-001000-1010 | CQ43 | 00010000100000-00100010-10001000-00000000-100100-101000-000101-001000-1010 |
| CQ15 | 01000010000000-01000100-01000100-00100010-010010-101000-000000-000010-0101 | CQ44 | 00010000100000-00100010-10001000-00000000-100100-101000-010010-010000-0101 |
| CQ16 | 00000000010100-10001000-10001000-01000100-100100-000101-010010-001000-0101 | CQ45 | 00100001000000-00010001-01000100-00100010-100100-000101-010010-000001-0101 |
| CQ17 | 00000100001000-00100010-00100010-00100010-001001-101000-000101-100000-1010 | CQ46 | 00010000100000-00010001-10001000-00100010-100100-010010-010010-010000-0101 |
| CQ18 | 00010000100000-01000100-00100010-10001000-010010-000101-000101-010000-1010 | CQ47 | 00010000100000-10001000-00100010-10001000-010010-000101-000101-000100-1010 |
| CQ19 | 00000100001000-00010001-01000100-00010001-010010-010010-101000-001000-1010 | CQ48 | 00000000010100-01000100-10001000-00100010-100100-010010-010010-000010-1010 |
| CQ20 | 00000100001000-10001000-00100010-00100010-010010-101000-000101-100000-0101 | CQ49 | 00010000100000-00010001-10001000-00100010-100100-010010-010010-000010-1010 |
| CQ21 | 00010000100000-00010001-10001000-01000100-010010-010010-010010-000010-0101 | CQ50 | 00000100001000-01000100-10001000-01000100-100100-010010-010010-000010-0101 |
| CQ22 | 00000100001000-00010001-00100010-00100010-001001-101000-000101-100000-1010 | CQ51 | 10001000000000-01000100-00100010-00100010-100100-000101-010010-000010-0101 |
| CQ23 | 00010000100000-00010001-10001000-01000100-010010-010010-010010-000010-1010 | CQ52 | 01000010000000-01000100-10001000-00010001-010010-000101-010010-000010-0101 |
| CQ24 | 00000100001000-01000100-00100010-00100010-001001-101000-101000-100000-1010 | CQ53 | 00010000100000-00010001-10001000-00100010-010010-000101-101000-100000-1010 |
| CQ25 | 00000100001000-01000100-00100010-00010001-100100-101000-101000-100000-1010 | CQ54 | 00010000100000-00100010-00100010-00010001-100100-101000-101000-100000-1010 |
| CQ26 | 00010000100000-00010001-10001000-01000100-100100-000101-010010-000010-0101 | CQ55 | 00010000100000-00100010-00100010-00100010-001001-101000-101000-100000-1010 |
| CQ27 | 00000100001000-00100010-10001000-01000100-010010-101000-101000-001000-0101 | CQ56 | 10001000000000-01000100-01000100-01000100-010010-000101-101000-000010-0101 |
| CQ28 | 00000000010100-10001000-00010001-00100010-010010-000101-101000-000100-1010 | CQ57 | 00000000010100-00010001-00100010-00010001-100100-010010-101000-001000-1010 |
| CQ29 | 00010000100000-00010001-10001000-00010001-100100-000101-010010-000010-0101 |
Table 6 Fingerprints of 57 pepper germplasms
| 编号Number | 指纹信息 Fingerprint information | 编号Number | 指纹信息 Fingerprint information |
|---|---|---|---|
| CQ01 | 00000100001000-01000100-10001000-00100010-100100-010010-101000-100000-1010 | CQ30 | 00010000100000-01000100-10001000-00100010-100100-000101-101000-000100-1010 |
| CQ02 | 00100001000000-01000100-01000100-00100010-001001-101000-010010-010000-1010 | CQ31 | 00100001000000-10001000-10001000-01000100-010010-101000-101000-000010-1010 |
| CQ03 | 00100001000000-10001000-01000100-01000100-010010-101000-010010-000001-1010 | CQ32 | 00100001000000-10001000-10001000-01000100-010010-000101-010010-000010-0101 |
| CQ04 | 00100001000000-00010001-01000100-01000100-010010-010010-010010-000010-0101 | CQ33 | 00100001000000-00010001-10001000-10001000-010010-000101-010010-100000-1010 |
| CQ05 | 00000000010100-01000100-10001000-00010001-100100-010010-010010-010000-0101 | CQ34 | 00010000100000-01000100-00100010-00100010-001001-101000-101000-100000-1010 |
| CQ06 | 00010000100000-01000100-00010001-00100010-001001-000101-010010-100000-1010 | CQ35 | 00010000100000-01000100-00100010-00010001-001001-101000-101000-100000-1010 |
| CQ07 | 00010000100000-00100010-10001000-00100010-100100-101000-010010-100000-0101 | CQ36 | 00010000100000-01000100-01000100-00100010-001001-101000-010010-010000-1010 |
| CQ08 | 00010000100000-00010001-10001000-00100010-100100-101000-010010-000010-0101 | CQ37 | 00000000000011-00010001-01000100-00100010-100100-000101-010010-000001-0101 |
| CQ09 | 00000100001000-00100010-00100010-00010001-100100-101000-010010-000001-0101 | CQ38 | 00000000000011-01000100-10001000-00010001-001001-101000-101000-000010-1010 |
| CQ10 | 00000000010100-10001000-00100010-00100010-100100-101000-010010-000010-1010 | CQ39 | 00000000000011-00010001-01000100-00100010-100100-101000-010010-000010-0101 |
| CQ11 | 01000010000000-10001000-00100010-00010001-010010-101000-000101-001000-1010 | CQ40 | 01000010000000-00010001-01000100-01000100-010010-101000-101000-001000-1010 |
| CQ12 | 00010000100000-00010001-00100010-00100010-010010-000101-101000-100000-1010 | CQ41 | 00100001000000-01000100-10001000-00100010-001001-101000-010010-010000-1010 |
| CQ13 | 00000100001000-00010001-00100010-00100010-010010-101000-101000-100000-0101 | CQ42 | 00010000100000-00010001-00100010-10001000-100100-010010-101000-100000-0101 |
| CQ14 | 00010000100000-10001000-10001000-01000100-010010-101000-010010-001000-1010 | CQ43 | 00010000100000-00100010-10001000-00000000-100100-101000-000101-001000-1010 |
| CQ15 | 01000010000000-01000100-01000100-00100010-010010-101000-000000-000010-0101 | CQ44 | 00010000100000-00100010-10001000-00000000-100100-101000-010010-010000-0101 |
| CQ16 | 00000000010100-10001000-10001000-01000100-100100-000101-010010-001000-0101 | CQ45 | 00100001000000-00010001-01000100-00100010-100100-000101-010010-000001-0101 |
| CQ17 | 00000100001000-00100010-00100010-00100010-001001-101000-000101-100000-1010 | CQ46 | 00010000100000-00010001-10001000-00100010-100100-010010-010010-010000-0101 |
| CQ18 | 00010000100000-01000100-00100010-10001000-010010-000101-000101-010000-1010 | CQ47 | 00010000100000-10001000-00100010-10001000-010010-000101-000101-000100-1010 |
| CQ19 | 00000100001000-00010001-01000100-00010001-010010-010010-101000-001000-1010 | CQ48 | 00000000010100-01000100-10001000-00100010-100100-010010-010010-000010-1010 |
| CQ20 | 00000100001000-10001000-00100010-00100010-010010-101000-000101-100000-0101 | CQ49 | 00010000100000-00010001-10001000-00100010-100100-010010-010010-000010-1010 |
| CQ21 | 00010000100000-00010001-10001000-01000100-010010-010010-010010-000010-0101 | CQ50 | 00000100001000-01000100-10001000-01000100-100100-010010-010010-000010-0101 |
| CQ22 | 00000100001000-00010001-00100010-00100010-001001-101000-000101-100000-1010 | CQ51 | 10001000000000-01000100-00100010-00100010-100100-000101-010010-000010-0101 |
| CQ23 | 00010000100000-00010001-10001000-01000100-010010-010010-010010-000010-1010 | CQ52 | 01000010000000-01000100-10001000-00010001-010010-000101-010010-000010-0101 |
| CQ24 | 00000100001000-01000100-00100010-00100010-001001-101000-101000-100000-1010 | CQ53 | 00010000100000-00010001-10001000-00100010-010010-000101-101000-100000-1010 |
| CQ25 | 00000100001000-01000100-00100010-00010001-100100-101000-101000-100000-1010 | CQ54 | 00010000100000-00100010-00100010-00010001-100100-101000-101000-100000-1010 |
| CQ26 | 00010000100000-00010001-10001000-01000100-100100-000101-010010-000010-0101 | CQ55 | 00010000100000-00100010-00100010-00100010-001001-101000-101000-100000-1010 |
| CQ27 | 00000100001000-00100010-10001000-01000100-010010-101000-101000-001000-0101 | CQ56 | 10001000000000-01000100-01000100-01000100-010010-000101-101000-000010-0101 |
| CQ28 | 00000000010100-10001000-00010001-00100010-010010-000101-101000-000100-1010 | CQ57 | 00000000010100-00010001-00100010-00010001-100100-010010-101000-001000-1010 |
| CQ29 | 00010000100000-00010001-10001000-00010001-100100-000101-010010-000010-0101 |

Fig. 7 SSR fingerprinting QR codes of 57 pepper germplasms
| [1] | 邹学校, 杨莎, 戴雄泽, 等.中国辣椒产业快速发展40年回顾与展望 [J]. 园艺学报, 2025, 52(1): 247-258. |
| Zou XX, Yang S, Dai XZ, et al. The rapid development of China's chili pepper industry over the past 40 years [J]. Acta Hortic Sin, 2025, 52(1): 247-258. | |
| [2] | Seungill K, Minkyu P, Seon-in Y, et al. Genome sequence of the hot pepper provides insights into the evolution of pungency in Capsicum species [J]. Nature genetics, 2014, 46(3): 270-278. |
| [3] | Arnon B, Yelena B, Sagit M, et al. pc8.1, a major QTL for pigment content in pepper fruit, is associated with variation in plastid compartment size [J]. Planta, 2012, 235(3): 579-588. |
| [4] | 段敏杰, 李怡斐, 王春萍, 等. 辣椒果实类胡萝卜素调控因子转录组和靶向代谢组分析 [J]. 园艺学报, 2024, 51(8): 1773-1791. |
| Duan MJ, Li YF, Wang CP, et al. Integrated transcriptomic and targeted metabolomic analysis reveals regulation of carotenoid accumulation during pepper fruit development [J]. Acta Hortic Sin, 2024, 51(8): 1773-1791. | |
| [5] | Deli J, Molnár P, Matus Z, et al. Carotenoid composition in the fruits of red paprika (Capsicum annuum var. lycopersiciforme rubrum) during ripening; biosynthesis of carotenoids in red paprika [J]. Journal of Agricultural and Food Chemistry, 2001, 49(3): 1517-1523. |
| [6] | 李平平, 张祥, 刘雨婷, 等. 辣椒63份种质果皮颜色与呈色物质的关系 [J]. 园艺学报, 2022, 49(7): 1589-1601. |
| Li PP, Zhang X, Liu YT, et al. Studies on the relationship between pigment composition and fruit coloration of 63 peppers [J]. Acta Hortic Sin, 2022, 49(7): 1589-1601. | |
| [7] | 岳林清, 吴怡超, 何星星, 等. 李资源果实主要性状的SSR标记关联分析及指纹图谱构建 [J]. 园艺学报, 2024, 51(11): 2495- 2509. |
| Yue LQ, Wu YC, He XX, et al. SSR marker association analysis and fingerprint construction of main traits of plum fruit [J]. Acta Hortic Sin, 2024, 51(11): 2495-2509. | |
| [8] | 管俊娇, 余志慧, 杨晓洪, 等. SSR标记在辣椒DUS测试中的应用研究 [J]. 植物遗传资源学报, 2019, 20(2): 396-405. |
| Guan JJ, Yu ZH, Yang XH, et al. Study on the application of SSR markers in pepper (Capsicum annuum L.) DUS testing [J]. J Plant Genet Resour, 2019, 20(2): 396-405. | |
| [9] | LiangYS, Yan C, Qin XJ, et al. Construction of three half-sib SSR linkage maps derived from overwintering cultivated rice and segregation distortion loci mapping [J]. Genome, 2020, 63(4): 239-251. |
| [10] | Kuang ZC, Xiao CS, Ilyas MK, et al. Use of SSR markers for the exploration of genetic diversity and DNA finger-printing in early-maturing upland cotton (Gossypium hirsutum L.) for future breeding program [J]. Agronomy, 2022, 12(7): 1513. |
| [11] | 陈志凯, 周仙莉, 张红岩, 等. 320份蚕豆蛋白质含量的SSR关联分析 [J]. 作物学报, 2024, 50(11): 2775-2786. |
| Chen ZK, Zhou XL, Zhang HY, et al. SSR association analysis of the protein content of 320 faba bean germplasms [J]. Acta Agronomica Sinica, 2024, 50(11): 2775-2786. | |
| [12] | 袁欣捷, 方荣, 周坤华, 等. 辣椒重要农艺性状关联分析与优异等位变异发掘 [J]. 核农学报, 2020, 34(12): 2658-2672. |
| Yuan XJ, Fang R, Zhou KH, et al. Association analysis of important agronomic traits in pepper (Capsicum annuum L.) and mining of elite alleles [J]. J Nucl Agric Sci, 2020, 34(12): 2658-2672. | |
| [13] | 王蜜蜜. 基于果实重要性状的辣椒优良种质筛选及分子标记关联分析 [D]. 滁州: 安徽科技学院, 2023. |
| Wang MM. Selection and molecular marker association analysis of pepper germplasm based on important fruits traits [D]. Chuzhou: Anhui Science and Technology University, 2023. | |
| [14] | Murray MG, Thompson WF. Rapid isolation of high molecular weight plant DNA [J]. Nucleic Acids Res, 1980, 8(19): 4321-4325. |
| [15] | Sugita T, Yamaguchi K, Kinoshita T, et al. QTL analysis for resistance to phytophthora blight (Phytophthora capsici Leon.) using an intraspecific doubled-haploid population of Capsicum annuum [J]. Breeding Science, 2006, 56(2): 137-145. |
| [16] | Sugita T, Semi Y, Sawada H, et al. Development of simple sequence repeat markers and construction of a high-density linkage map of Capsicum annuum [J]. Molecular Breeding, 2013, 31(4): 909-920. |
| [17] | Minamiyama Y, Tsuro M, Hirai M. An SSR-based linkage map of Capsicum annuum [J]. Mol Breed, 2006, 18(2): 157-169. 157-169. |
| [18] | Lee JM, Nahm SH, Kim YM, et al. Characterization and molecular genetic mapping of microsatellite loci in pepper [J]. Theoretical and Applied Genetics, 2004, 108(4): 619-627. |
| [19] | Yi GB, Lee JM, Lee S, et al. Exploitation of pepper EST-SSRs and an SSR-based linkage map [J]. Theoretical and Applied Genetics, 2006, 114(1): 113-130. |
| [20] | Nagy I, Stágel A, Sasvári Z, et al. Development, characterization, and transferability to other Solanaceae of microsatellite markers in pepper (Capsicum annuum L.) [J]. Genome, 2007, 50(7): 668-688. |
| [21] | 樊文强, 盖红梅, 孙鑫, 等. SSR数据格式转换软件DataFormater [J]. 分子植物育种, 2016, 14(1): 265-270. |
| Fan WQ, Gai HM, Sun X, et al. Data formater, a software for SSR data formatting to develop population genetics analysis [J]. Mol Plant Breed, 2016, 14(1): 265-270. | |
| [22] | Chen CJ, Wu Y, Li JW, et al. TBtools-II: A “One for All, All for One” bioinformatics platform for biological big-data mining [J]. Molecular plant, 2023, 16(11): 1733-1742. |
| [23] | 马庆国, 宋晓波, 贺君星, 等. 基于SSR分子标记的核桃种质资源分子身份证构建 [J]. 植物资源与环境学报, 2023, 32(2): 1-9. |
| Ma QG, Song XB, He JX, et al. Establishment of molecular identity cards of walnut (Juglans spp.) germplasm resources based on SSR molecular marker [J]. J Plant Resour Environ, 2023, 32(2): 1-9. | |
| [24] | 李莎. 西南地区辣椒种质资源评价及遗传多样性分析 [D]. 雅安: 四川农业大学, 2017. |
| Li S. Evaluation and genetic diversity analysis of capsicum varieties collected from southwest China [D]. Ya’an: Sichuan Agricultural University, 2017. | |
| [25] | 张敏. 色素辣椒种质资源评价及遗传多样性分析 [D]. 太谷: 山西农业大学, 2022. |
| Zhang M. Evaluation and genetic diversity analysis of pepper germplasm resources [D]. Taigu: Shanxi Agricultural University, 2022. | |
| [26] | 袁雷, 吉雪花, 张国儒, 等. 52份辣椒主要果实性状的遗传多样性及聚类分析 [J]. 新疆农业科学, 2022, 59(8): 1935-1944. |
| Yuan L, Ji XH, Zhang GR, et al. Genetic diversity and cluster analysis on the main fruit characters of 52 accessions of Capsicum [J]. Xinjiang Agric Sci, 2022, 59(8): 1935-1944. | |
| [27] | 尹成刚, 刘建萍, 易晓华, 等. 色素辣椒品种资源色价评估及育种潜力分析 [J]. 中国农学通报, 2009, 25(23): 303-307. |
| Yin CG, Liu JP, Yi XH, et al. The evaluation of color value unite and analysis of breeding potential of paprika red chilli breeding resources [J]. Chin Agric Sci Bull, 2009, 25(23): 303-307. | |
| [28] | 安苗, 王彤彤, 付逸婷, 等. 52个马铃薯遗传多样性分析及SSR分子身份证构建 [J]. 生物技术通报, 2023, 39(12): 136-147. |
| An M, Wang TT, Fu YT, et al. Genetic diversity analysis and molecular identity card construction by SSR markers of 52 Solanum tuberosum L. varieties (lines) [J]. Biotechnol Bull, 2023, 39(12): 136-147. | |
| [29] | 毛向红, 卢瑶, 范向斌, 等. 基于SSR荧光标记毛细管电泳的马铃薯品种遗传多样性分析及分子身份证构建 [J]. 生物技术通报, 2024, 40(9): 131-140. |
| Mao XH, Yu Y, Fan XB, et al. Genetic diversity analysis of potato varieties based on SSR fluorescent marker capillary electrophoresis and construction of molecular identity card [J]. Biotechnol Bull, 2024, 40(9): 131-140. | |
| [30] | 李子航, 何立飞, 王秀军, 等. 基于SSR分子标记的地被菊遗传多样性分析和指纹图谱构建 [J]. 生物工程学报, 2023, 39(7): 2839-2860. |
| Li ZH, He LF, Wang XJ, et al. Genetic diversity analysis and fingerprints of Chrysanthemum × morifolium based on SSR molecular markers [J]. Chinese Journal of Biotechnology, 2023, 39(7): 2839-2860. | |
| [31] | 雷刚, 陈学军, 周坤华, 等. 60份辣椒骨干亲本的SSR遗传多样性分析及指纹图谱构建 [J]. 植物遗传资源学报, 2024, 25(8): 1321-1335. |
| Lei G, Chen XJ, Zhou KH, et al. Genetic diversity and fingerprint analysis in 60 founder parents of pepper based on SSR markers [J]. China Ind Econ, 2024, 25(8): 1321-1335. | |
| [32] | 傅鸿妃, 吕晓菡, 陈建瑛, 等. 辣椒种质表型性状与SSR分子标记的遗传多样性分析 [J]. 核农学报, 2018, 32(7): 1309-1319. |
| Fu HF, Lyu XH, Chen JY, et al. Genetic diversity analysis of Capsicum germplasm based on phenotypic traits with SSR markers [J]. J Nucl Agric Sci, 2018, 32(7): 1309-1319. | |
| [33] | 孟俊瑛, 郭瑞, 陈高, 等. 辣椒地方品种和创新种质的遗传比较分析 [J]. 植物遗传资源学报, 2024, 25(10): 1685-1696. |
| Meng JY, Guo R, Chen G, et al. Genetic comparative studies on innovated germplasm and local varieties of chili pepper [J]. China Ind Econ, 2024, 25(10): 1685-1696. | |
| [34] | 张曼, 常媚瑕, 张才鲜, 等. 利用SSR分子标记分析35份朝天椒种质遗传差异性 [J]. 石河子大学学报: 自然科学版, 2022, 40(6): 713-718. |
| Zhang M, Chang MX, Zhang CX, et al. Genetic difference analysis of 35 Capsicum frutescens germplasm using SSR molecular markers [J]. J Shihezi Univ Nat Sci, 2022, 40(6): 713-718. | |
| [35] | 张强强, 梁赛, 王艳, 等. 基于表型性状和SSR标记的57份辣椒种质遗传多样性分析 [J]. 热带亚热带植物学报, 2020, 28(4): 356-366. |
| Zhang QQ, Liang S, Wang Y, et al. Genetic diversity analysis of 57 germplasms of Capsicum annuum based on phenotypic traits and SSR markers [J]. J Trop Subtrop Bot, 2020, 28(4): 356-366. | |
| [36] | Konishi A, Furutani N, Minamiyama Y, et al. Detection of quantitative trait loci for capsanthin content in pepper (Capsicum annuum L.) at different fruit ripening stages [J]. Breeding Science, 2019, 69(1): 30-39. |
| [37] | Thorup TA, Tanyolac B, Livingstone KD, et al. Candidate gene analysis of organ pigmentation loci in the Solanaceae [J]. Proc Natl Acad Sci USA, 2000, 97(21): 11192-11197. |
| [38] | Jang S, Kim GW, Han K, et al. Investigation of genetic factors regulating chlorophyll and carotenoid biosynthesis in red pepper fruit [J]. Frontiers in Plant Science, 2022, 13: 922963. |
| [39] | 张芳芳, 张正海, 毛胜利, 等. 辣椒成熟果实中辣椒红素含量的QTL定位 [J]. 中国蔬菜, 2010(20): 14-18. |
| Zhang FF, Zhang ZH, Mao SL, et al. QTL analysis of capsanthin content in pepper (Capsicum annuum L.) mature fruit [J]. China Veg, 2010(20): 14-18. | |
| [40] | 孙泽硕, 蒋冬月, 柳新红, 等. 基于SSR标记的42份樱花品种的聚类分析及DNA指纹图谱构建 [J]. 园艺学报, 2023, 50(3): 657-668. |
| Sun ZS, Jiang DY, Liu XH, et al. Cluster analysis and construction of DNA fingerprinting of 42 oriental cultivars of flowering cherry based on SSR markers [J]. Acta Hortic Sin, 2023, 50(3): 657-668. | |
| [41] | 冯鹏龙, 韩睿, 王亚艺, 等. 基于SSR标记辣椒品种DNA指纹图谱的构建 [J]. 西北农业学报, 2022, 31(3): 320-327. |
| Feng PL, Han R, Wang YY, et al. Construction of DNA fingerprints of pepper (Capsicum annuum L.) varieties based on SSR markers [J]. Acta Agric Boreali Occidentalis Sin, 2022, 31(3): 320-327. | |
| [42] | Waits LP, Luikart G, Taberlet P. Estimating the probability of identity among genotypes in natural populations: cautions and guidelines [J]. Mol Ecol, 2001, 10(1): 249-256. |
| [1] | DUAN Yong-hong, YANG Xin, YU Guan-qun, XIA Jun-jun, SONG Lu-shuai, BAI Xiao-dong, PENG Suo-tang. Genetic Diversity and Principal Component Analysis of 125 Potato Germplasm Resources [J]. Biotechnology Bulletin, 2025, 41(6): 130-143. |
| [2] | PENG Shao-zhi, WANG Deng-ke, ZHANG Xiang, DAI Xiong-ze, XU Hao, ZOU Xue-xiao. Cloning, Expression Characteristics and Functional Verification of the Pepper CaFD1 Gene [J]. Biotechnology Bulletin, 2025, 41(5): 153-164. |
| [3] | WANG Tian-tian, CHANG Xue-rui, HUANG Wan-yang, HUANG Jia-xin, MIAO Ru-yi, LIANG Yan-ping, WANG Jing. Identification and Analysis of GASA Gene Family in Pepper (Capsicum annuum L.) [J]. Biotechnology Bulletin, 2025, 41(4): 166-175. |
| [4] | YU Jing, YU Gui-shuang, SUN Hao-jie, JIANG Chun-jiao, YUAN Guang-di, YANG Zhen, WANG Zhi-wei, WANG Chao, WANG Chuan-tang. Affecting Factors and Relevant Marker Study on Peanut Seed Quality [J]. Biotechnology Bulletin, 2025, 41(2): 284-294. |
| [5] | HE Han, LIU Chuan-he, YU Meng-fan, YUAN Meng-ping, WEI Yue-rong, YANG Min, KUANG Rui-bin, ZHOU Chen-ping, WU Xia-ming, XU Ze. Development of Insertion-deletion Markers in Ananas comosus of Genome Based on Re-sequencing Data [J]. Biotechnology Bulletin, 2025, 41(2): 65-76. |
| [6] | SONG Ying-pei, WANG Can, ZHOU Hui-wen, KONG Ke-ke, XU Meng-ge, WANG Rui-kai. Analysis of Soybean Pod Dehiscence Habit Based on Whole Genome Association Analysis and Genetic Diversity [J]. Biotechnology Bulletin, 2025, 41(2): 97-106. |
| [7] | LIU Qian, MA Lian-jie, ZHANG Hui, WANG Dong, FAN Mao, LIAO Dun-xiu, ZHAO Zheng-wu, LU Wen-cai. Screening, Identification and Control Effects of Biocontrol Strain TN2 against Pepper Anthracnose [J]. Biotechnology Bulletin, 2025, 41(1): 287-297. |
| [8] | MAO Xiang-hong, LU Yao, FAN Xiang-bin, DU Pei-bing, BAI Xiao-dong. Genetic Diversity Analysis of Potato Varieties Based on SSR Fluorescent Marker Capillary Electrophoresis and Construction of Molecular Identity Card [J]. Biotechnology Bulletin, 2024, 40(9): 131-140. |
| [9] | WU Hui-qin, WANG Yan-hong, LIU Han, SI Zheng, LIU Xue-qing, WANG Jing, YANG Yi, CHENG Yan. Identification and Expression Analysis of UGT Gene Family in Pepper [J]. Biotechnology Bulletin, 2024, 40(9): 198-211. |
| [10] | SUN Zhi-yong, DU Huai-dong, LIU Yang, MA Jia-xin, YU Xue-ran, MA Wei, YAO Xin-jie, WANG Min, LI Pei-fu. Genome-wide Association Analysis of γ-aminobutyric Acid in Rice Grains [J]. Biotechnology Bulletin, 2024, 40(8): 53-62. |
| [11] | LI Si-qi, ZHANG Wen-chen, YANG Liu, FU Qing-xin, HONG Xin, ZHANG Hai-wang. Genetic Diversity Analysis and DNA Fingerprint Construction Based on SSR Markers for Xanthoceras sorbifolia [J]. Biotechnology Bulletin, 2024, 40(5): 74-83. |
| [12] | MAO Li-jie, LIANG Xiao, LIU Ying, WU Chun-ling, HAN Xiao-yan, CHEN Qing. Mechanism of CMV Intervention in Peach Aphid Population Growth by Influencing the Expression of Effector MpC002 [J]. Biotechnology Bulletin, 2024, 40(4): 271-277. |
| [13] | WANG Juan, WANG Xin, TIAN Qin, MA Xiao-mei, ZHOU Xiao-feng, LI Bao-cheng, DONG Cheng-guang. Association Analysis and Exploration of Elite Alleles of Plant Architecture Traits in Gossypium hirsutum L. [J]. Biotechnology Bulletin, 2024, 40(3): 146-154. |
| [14] | CHEN Kai-ling, WU Tao, XU Yi-qun, GAO Jia, ZHANG Mei-jun, LI Xin, JIA Ju-qing. Identification of SSR Loci and Development of Polymorphic Markers in Whole Genome of Oat [J]. Biotechnology Bulletin, 2024, 40(2): 120-129. |
| [15] | LI Bai-xue, LI Jin-ling, CHEN Chun-lin, DU Qing-jie, LI Meng, WANG Ji-qing, MA Yong-bin, XIAO Huai-juan. Cloning and Expression Analysis of CabZIP42 Gene in Pepper [J]. Biotechnology Bulletin, 2024, 40(12): 93-101. |
| Viewed | ||||||
|
Full text |
|
|||||
|
Abstract |
|
|||||